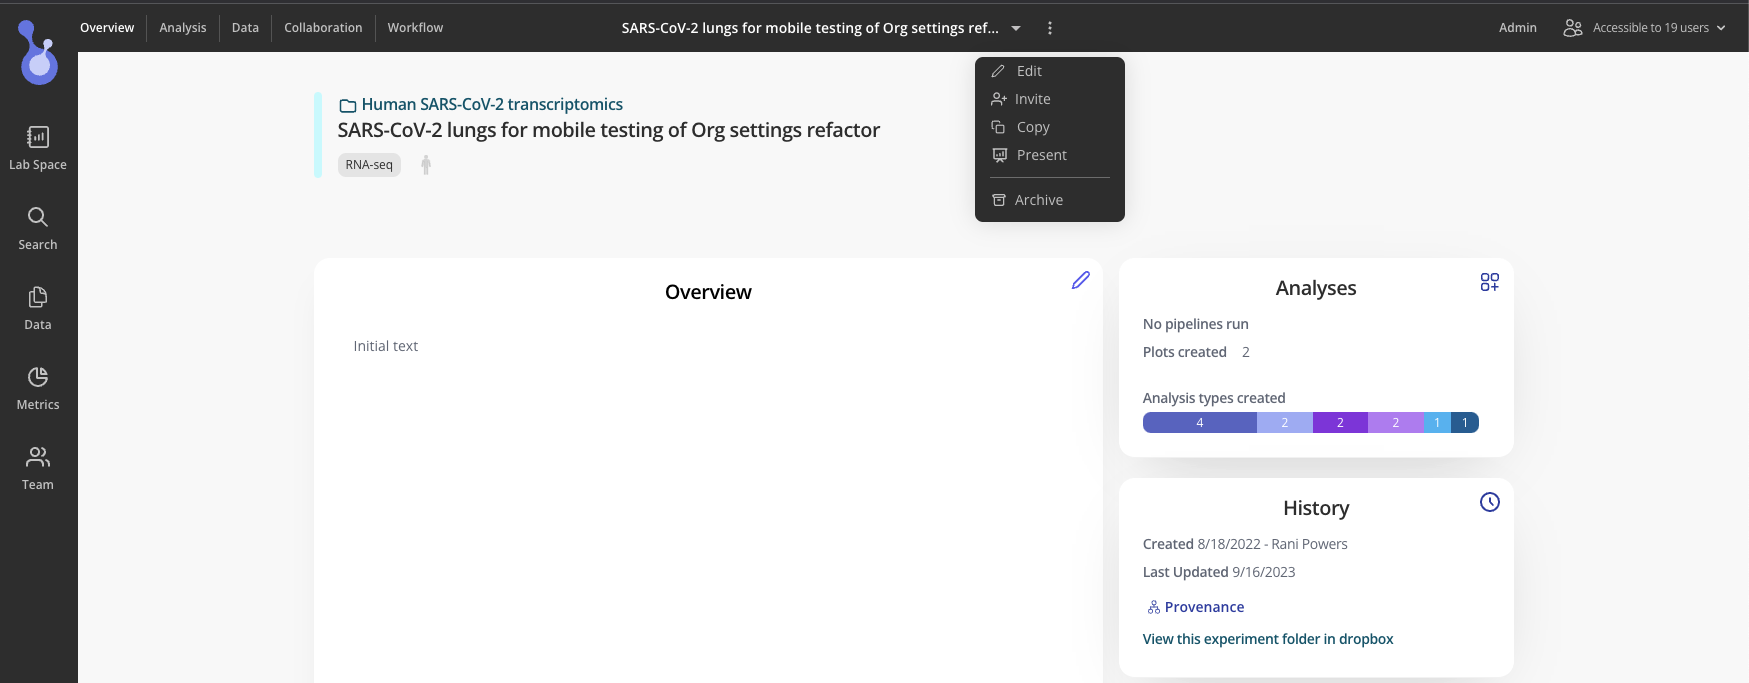
Understanding the tabs/views within an experiment
Overview Tab
The Experiment overview tab will reference a few things:
- Overview: This is the description of the Experiment that can be used to state your hypothesis, study design, key results, interpretation, etc...
- This supports text inputs as well as markdown formatting
- Analysis Snapshot
- This shows the number of pipeline runs, plots created, and the types of analysis that have been performed on this experiment.
- History
- This shows the date the experiment was created and last updated, and links out to the full change history and provenance.
- Project/experiment Drop down: Quickly access all Experiments within the project

- Edit Experiment (Edit, Invite, Copy, Present, Archive)

Analysis Tab
The Analysis tab will show all of the plots and graphs you have created from the experimental data, as well as any text or image widgets you have added
Data
This tab gives you easy access to the data and analyses stored within your lab space
Collaboration
The Collaboration tab shows who has access to the experiment, as well as their designated permission level.
The change history is accessible here as well, in addition to a shareable link for the experiment, plus any custom links you'd like to add.
Workflow
The workflow tab provides quick access to the items below:
- API IDs
- R package (accessing Pluto programmatically)
- GET sample data
- GET assay Data
- Get Result Data
- Sync with Benchling
- Python SDK (accessing Pluto programmatically)
