Transform FASTQ files into interactive results pages with a few clicks
Streamlined bulk RNA-seq analysis
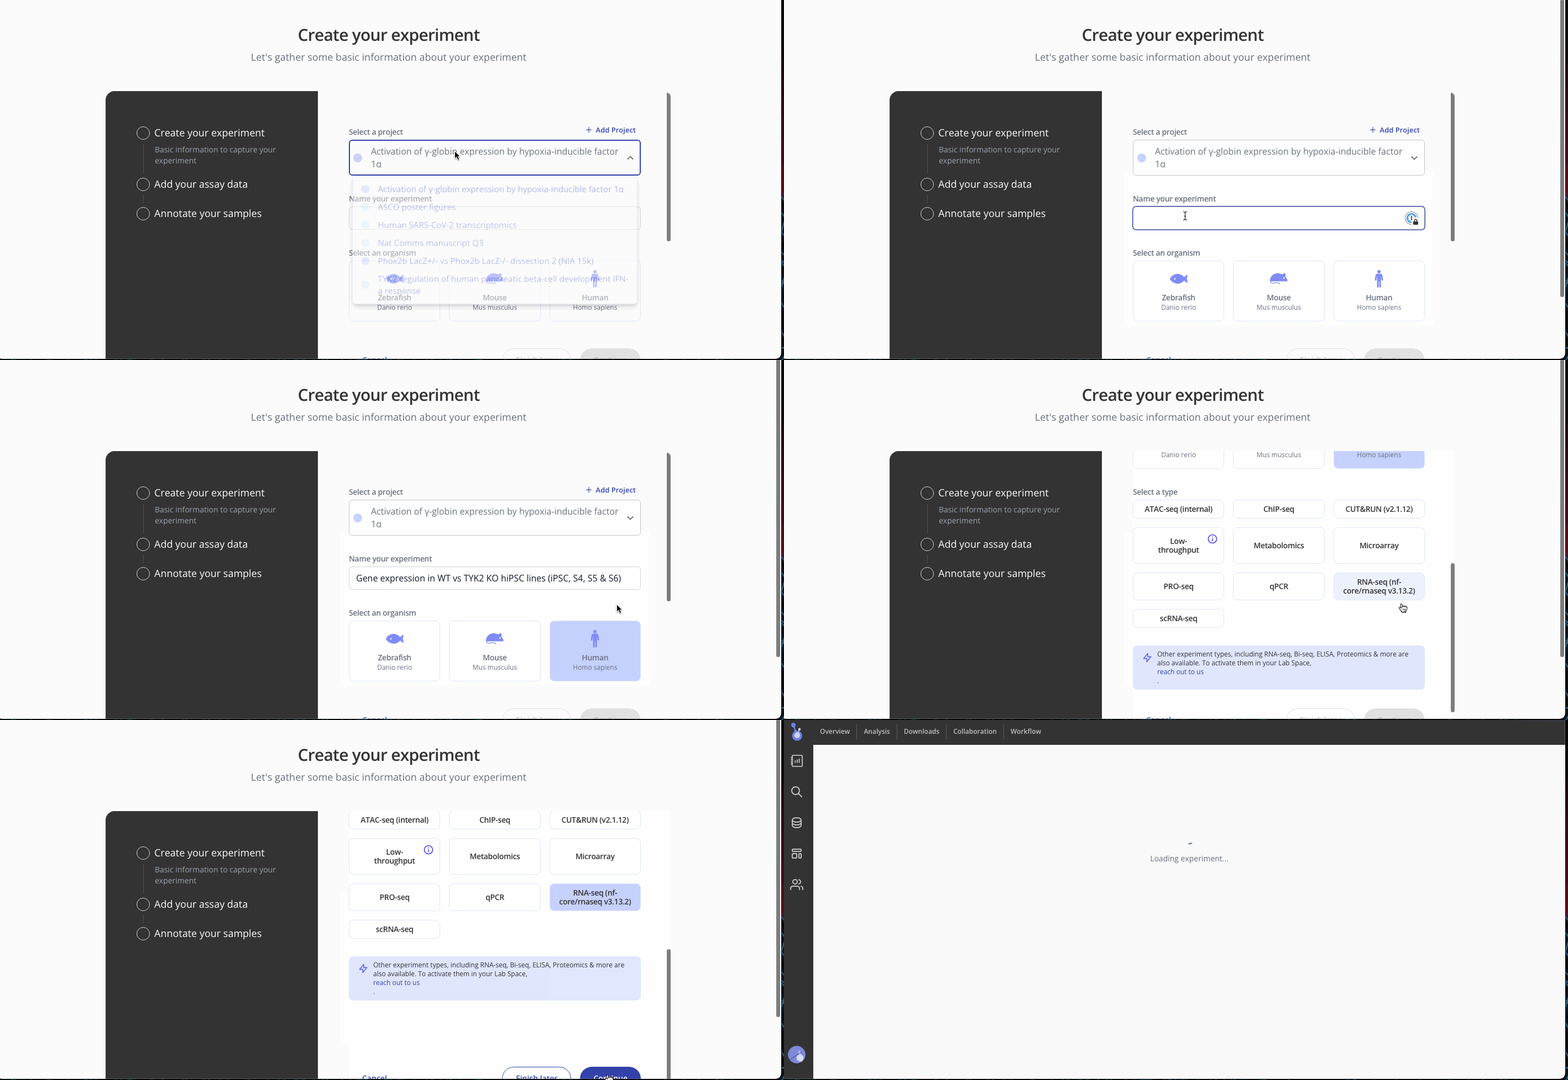
Step 1: Create experiment
To begin your analysis, navigate to your Lab Space and create a new bulk RNA-seq experiment.
Step 2: Upload gene expression data
If you're starting with FASTQ files, you can upload them directly by selecting the FASTQ file tab and dragging them into the upload box. These FASTQ files will be preprocessed, aligned to the genome of the organism you selected, QC-checked, and transformed into a count matrix, which is available for download from the Experiment page (see Step 4 below).
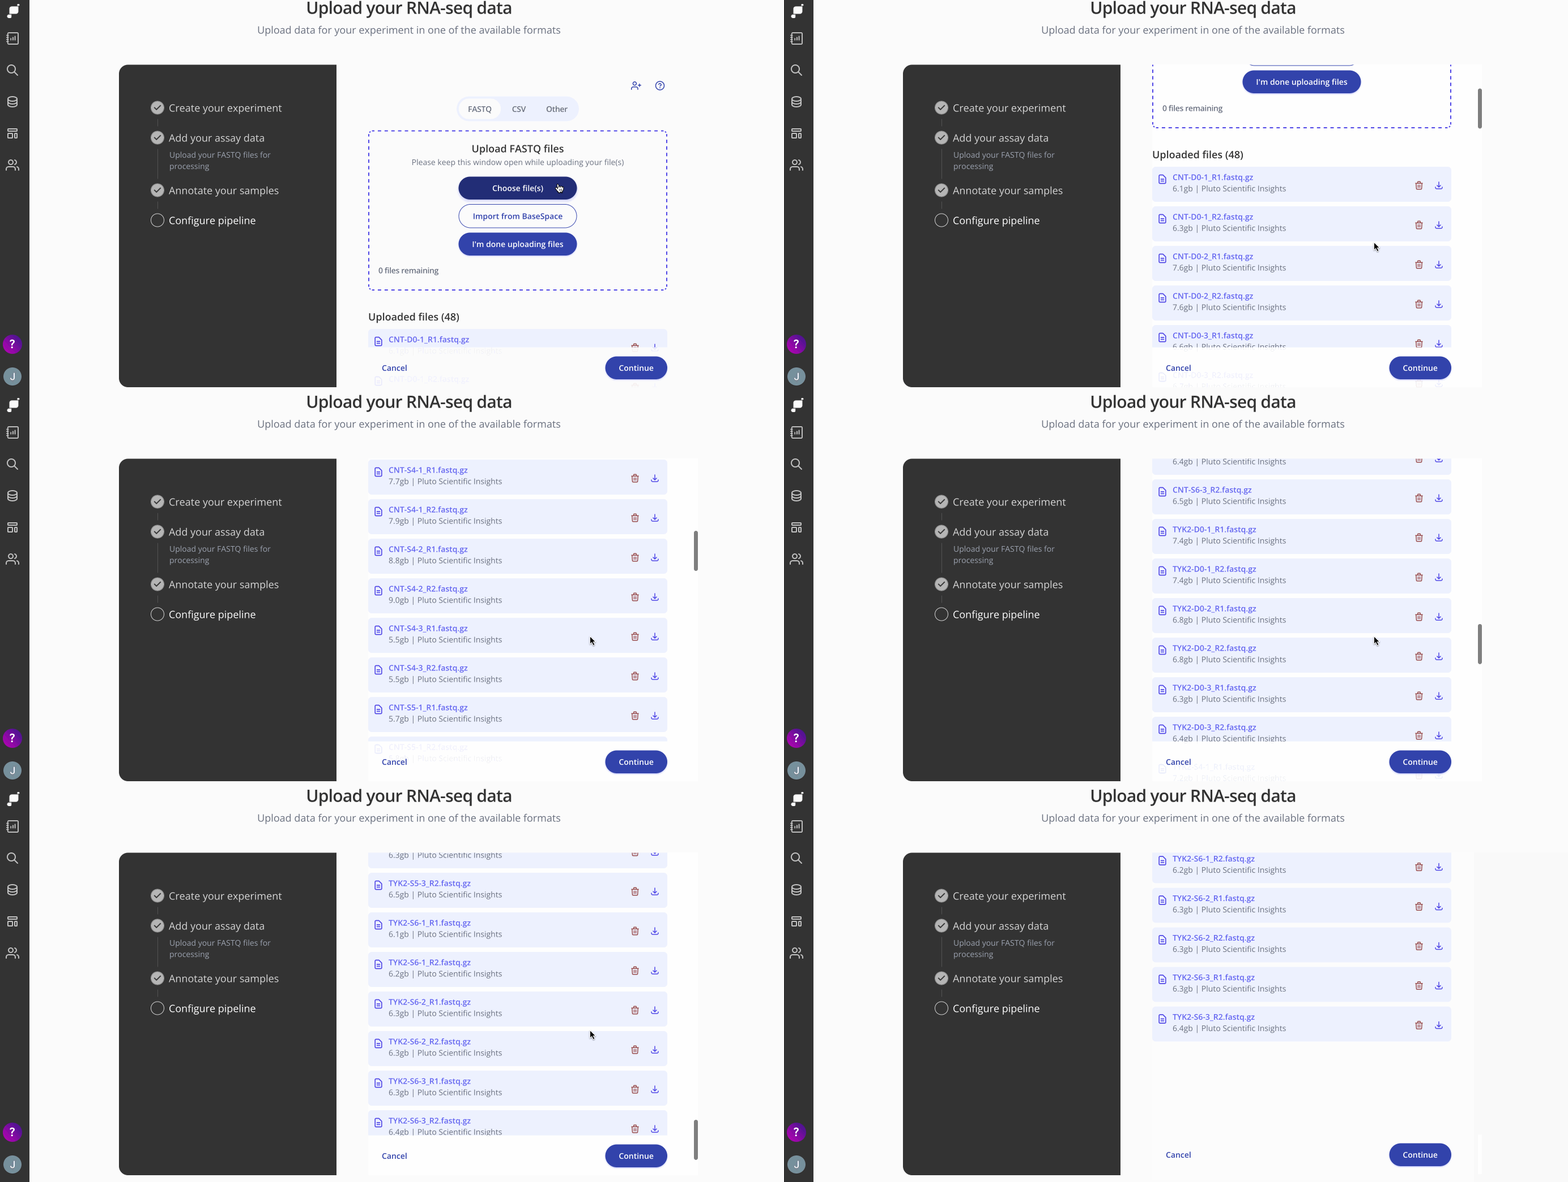
Tip 1: Does the sequencing company or another collaborator have your FASTQ files? No problem! Just invite them to the experiment as an Editor and they'll be able to upload the FASTQ files, or contact us about a direct file transfer from cloud storage or another location.
Step 3: Upload sample annotations
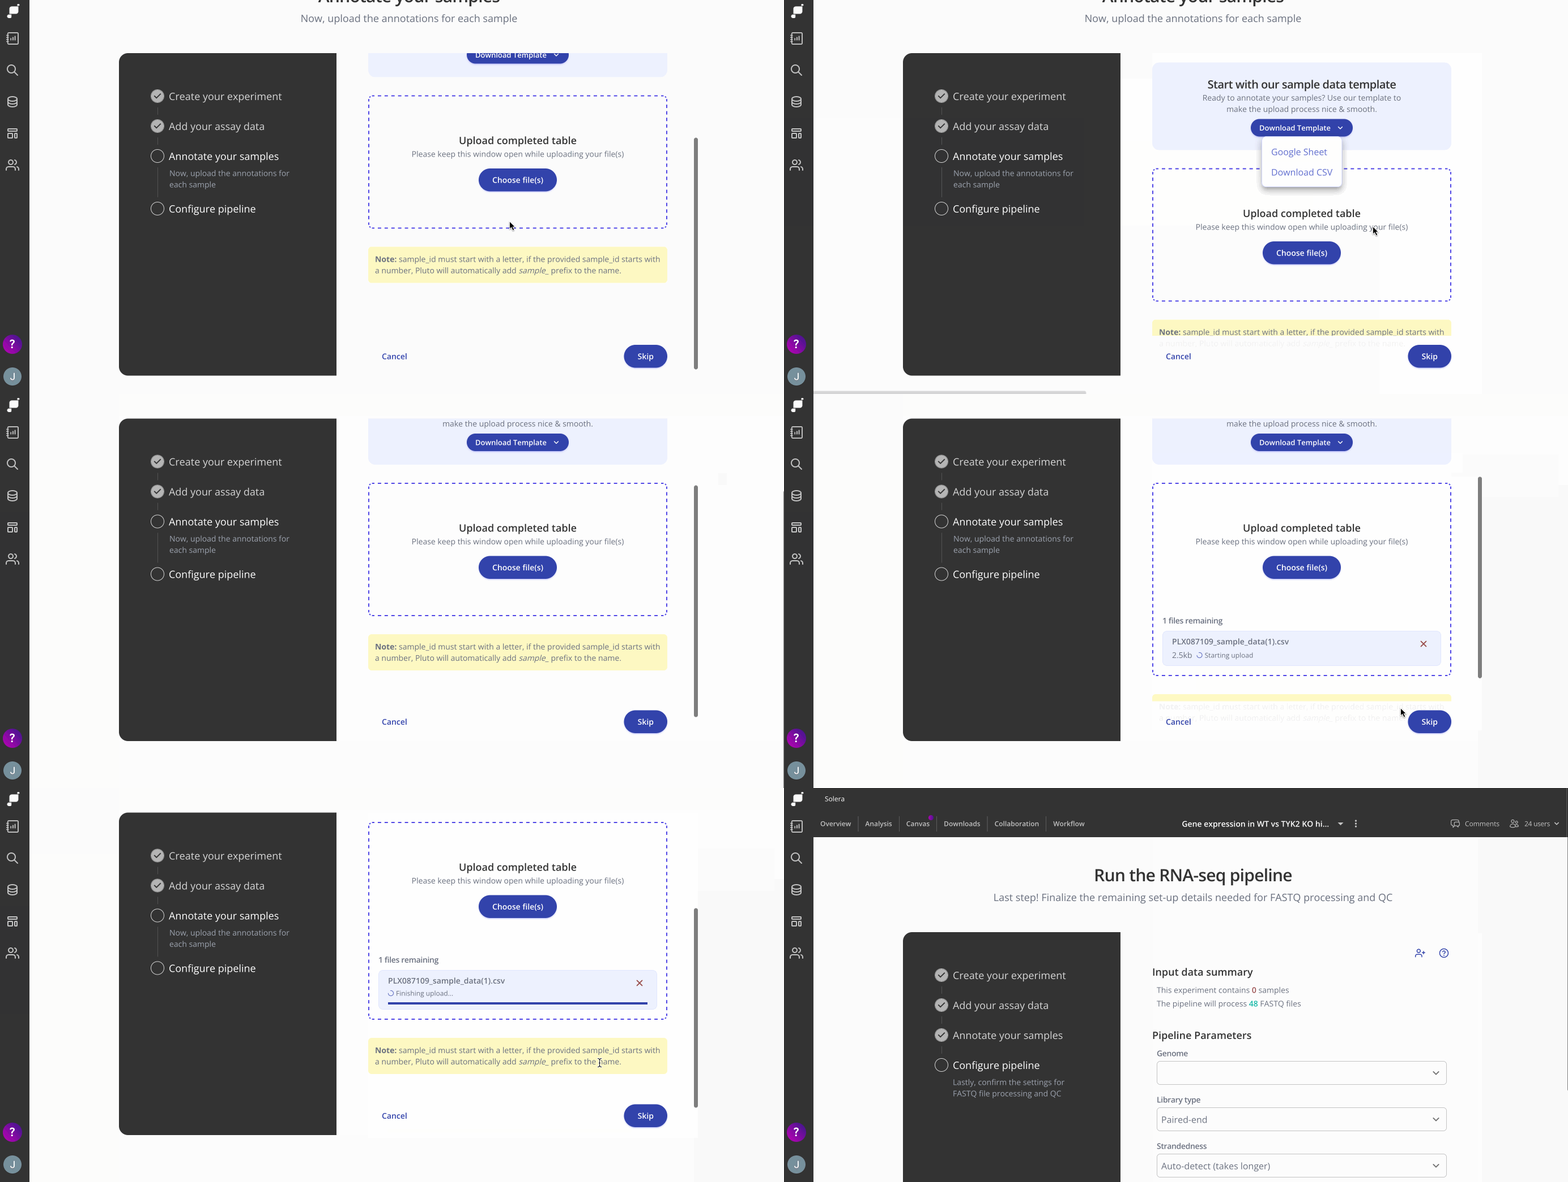
To define your samples, create a CSV file containing the sample IDs from the data uploaded in step 2, plus one columns for each relevant annotation, such as age, sex, treatments, doses, or other conditions. Here's one example:

Tip: Pluto sample tables can contain a variety of metadata. Take a look at our template here for more information.
Upload the CSV file and click Continue to view your newly created experiment and begin analyzing!
Step 4: Configure Pipeline
Next, you'll configure some pipeline settings to set up your analysis. Here you'll choose your genome annotation, library type and strandedness. 
Genome - the annotations available here will depend on which organism you chose when setting up your experiment on Pluto. If this experiment is part of a series of experiments, make sure to choose the same genome as your previous analyses.
Library type - Either paired end or single end, this will depend on how the sequencing libraries are prepared. Most bulk RNA-seq libraries are paired end.
Strandedness - Choose the strandedness of your samples, either forward, reverse, unstranded. There is also an auto detect option. Check out this article for additional information on how to pick which setting is best for your experiment.
Step 5: Run differential expression analysis
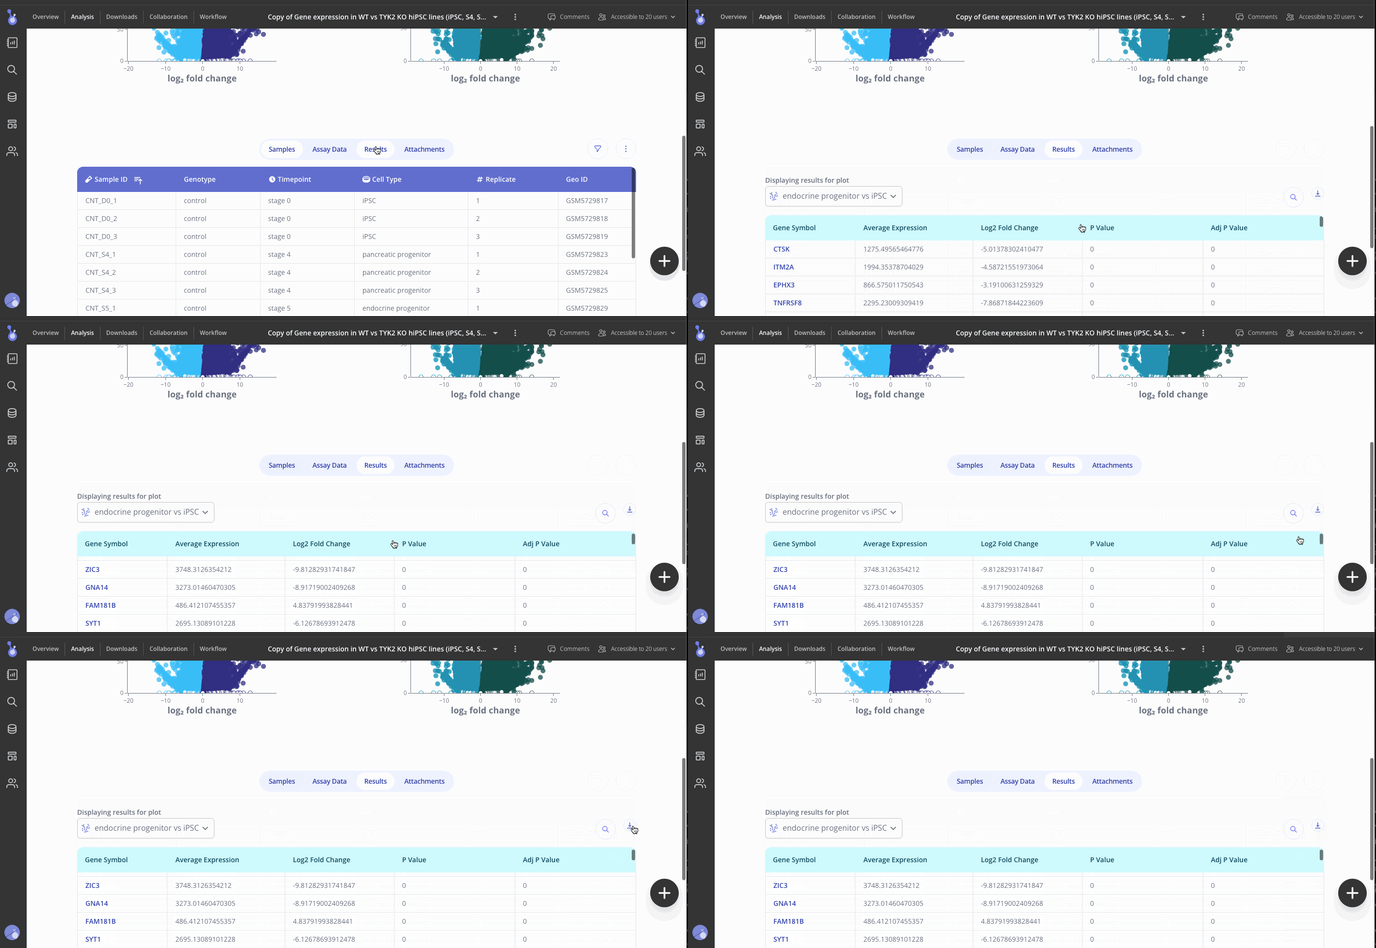
Welcome to your shiny new Experiment page! The assay data and sample data tables you uploaded are shown on the bottom half of the page. The top half of the page doesn't look like much yet, but we'll change that now. Click Start Analysis and begin your analysis by selecting the two groups that you'd like to compare using differential expression and click Submit. You can add as many plots as you'd like to your experiment.
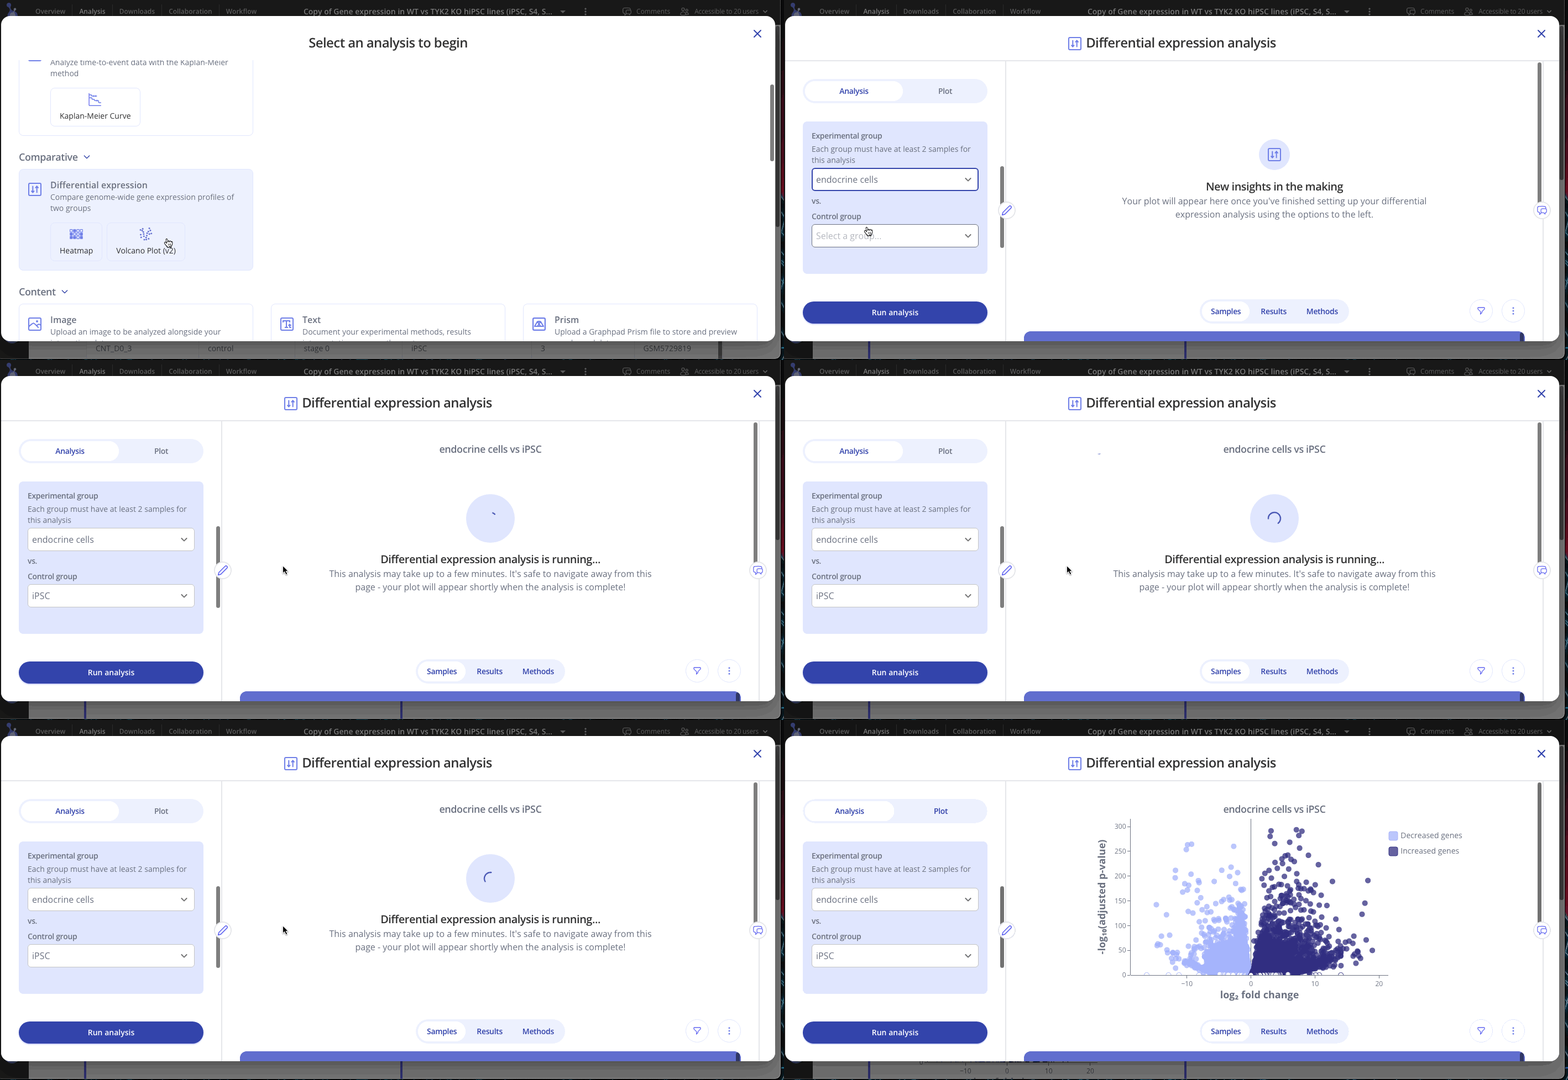
Use the Edit Plot menu to customize the plot title and appearance. You can also view and download the differentially expressed gene (DEG) table for each analysis that you've run.
Step 5: Share your results
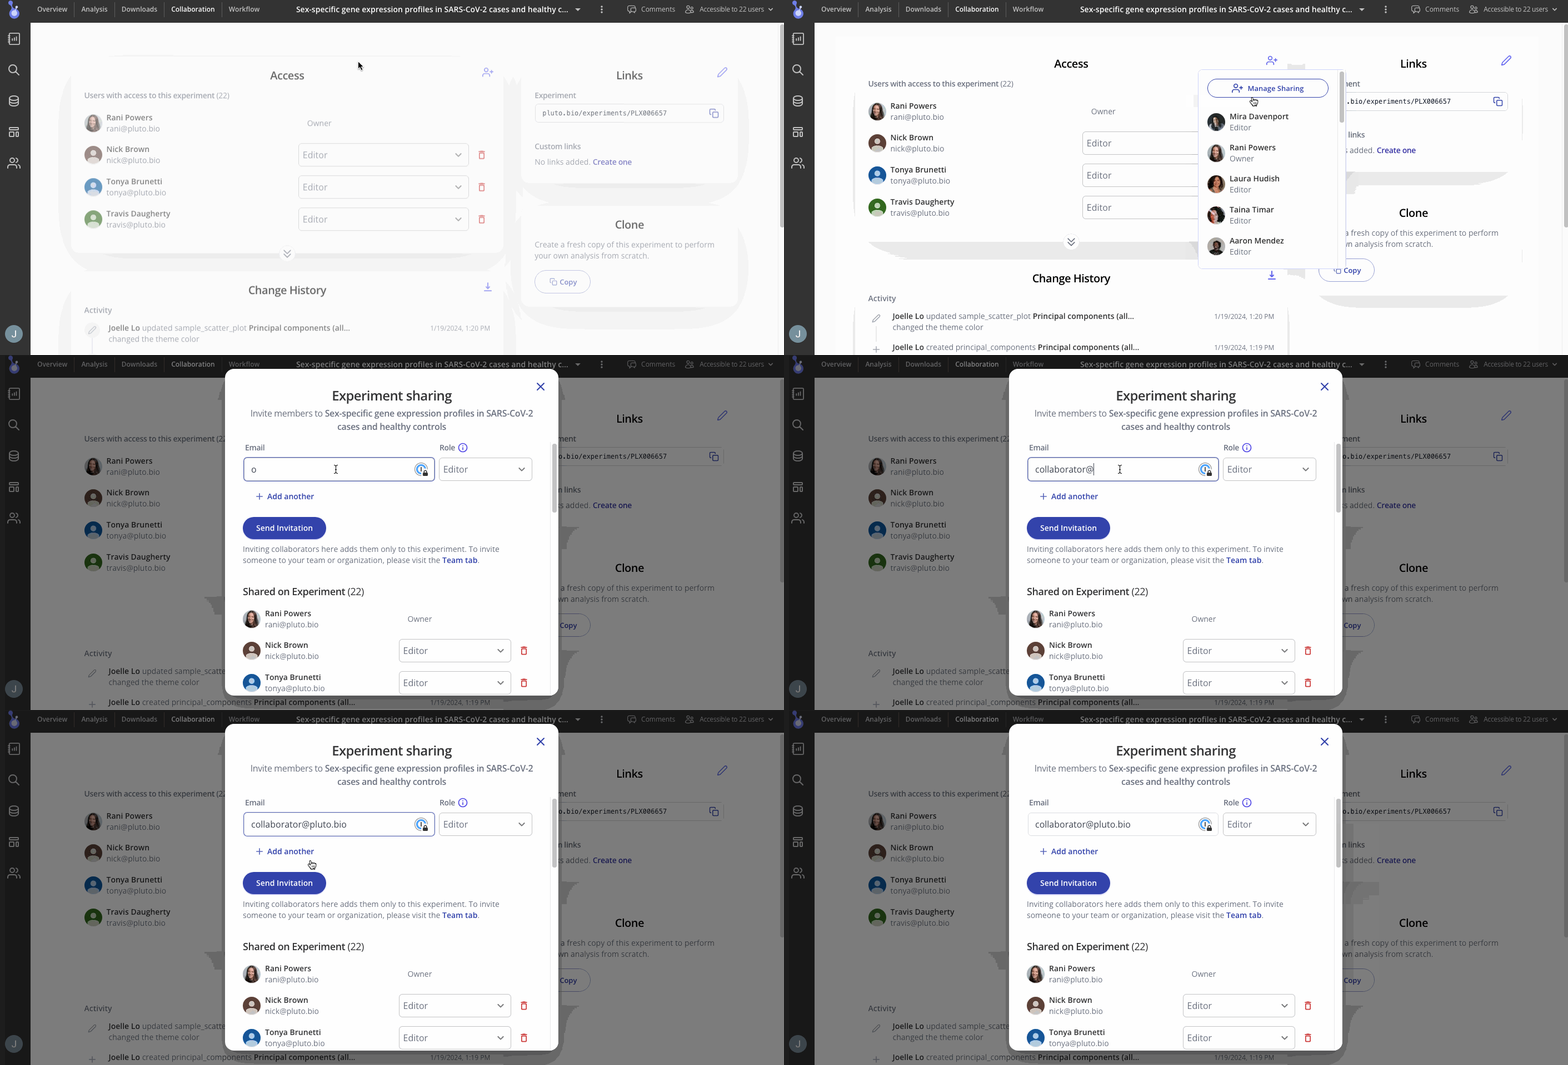
Collaborators for your experiment can be found in the "Collaboration" tab in your menu at the top of the screen. In the Access menu, you can view who has access to your experiment and their editing permissions. To add more collaborators, use the button at the top right of the access menu to invite them to view or add more results.
Step 6: Take your analysis to the next level!
Ready to perform pathway analysis on the differentially expressed genes, or do some machine learning-based biomarker identification? The Pluto Scientific Solutions team is available to perform custom analysis tailored to your specific experiment and hypotheses. Use the chat button at the bottom right, or directly email, your lab's designated Scientific Solutions Consultant with the analysis you need. You'll grant them temporary, view-only access to the experiment in order to perform your analysis, and then you'll receive an email notifying you when your results are ready to view in the Pluto Report tab!
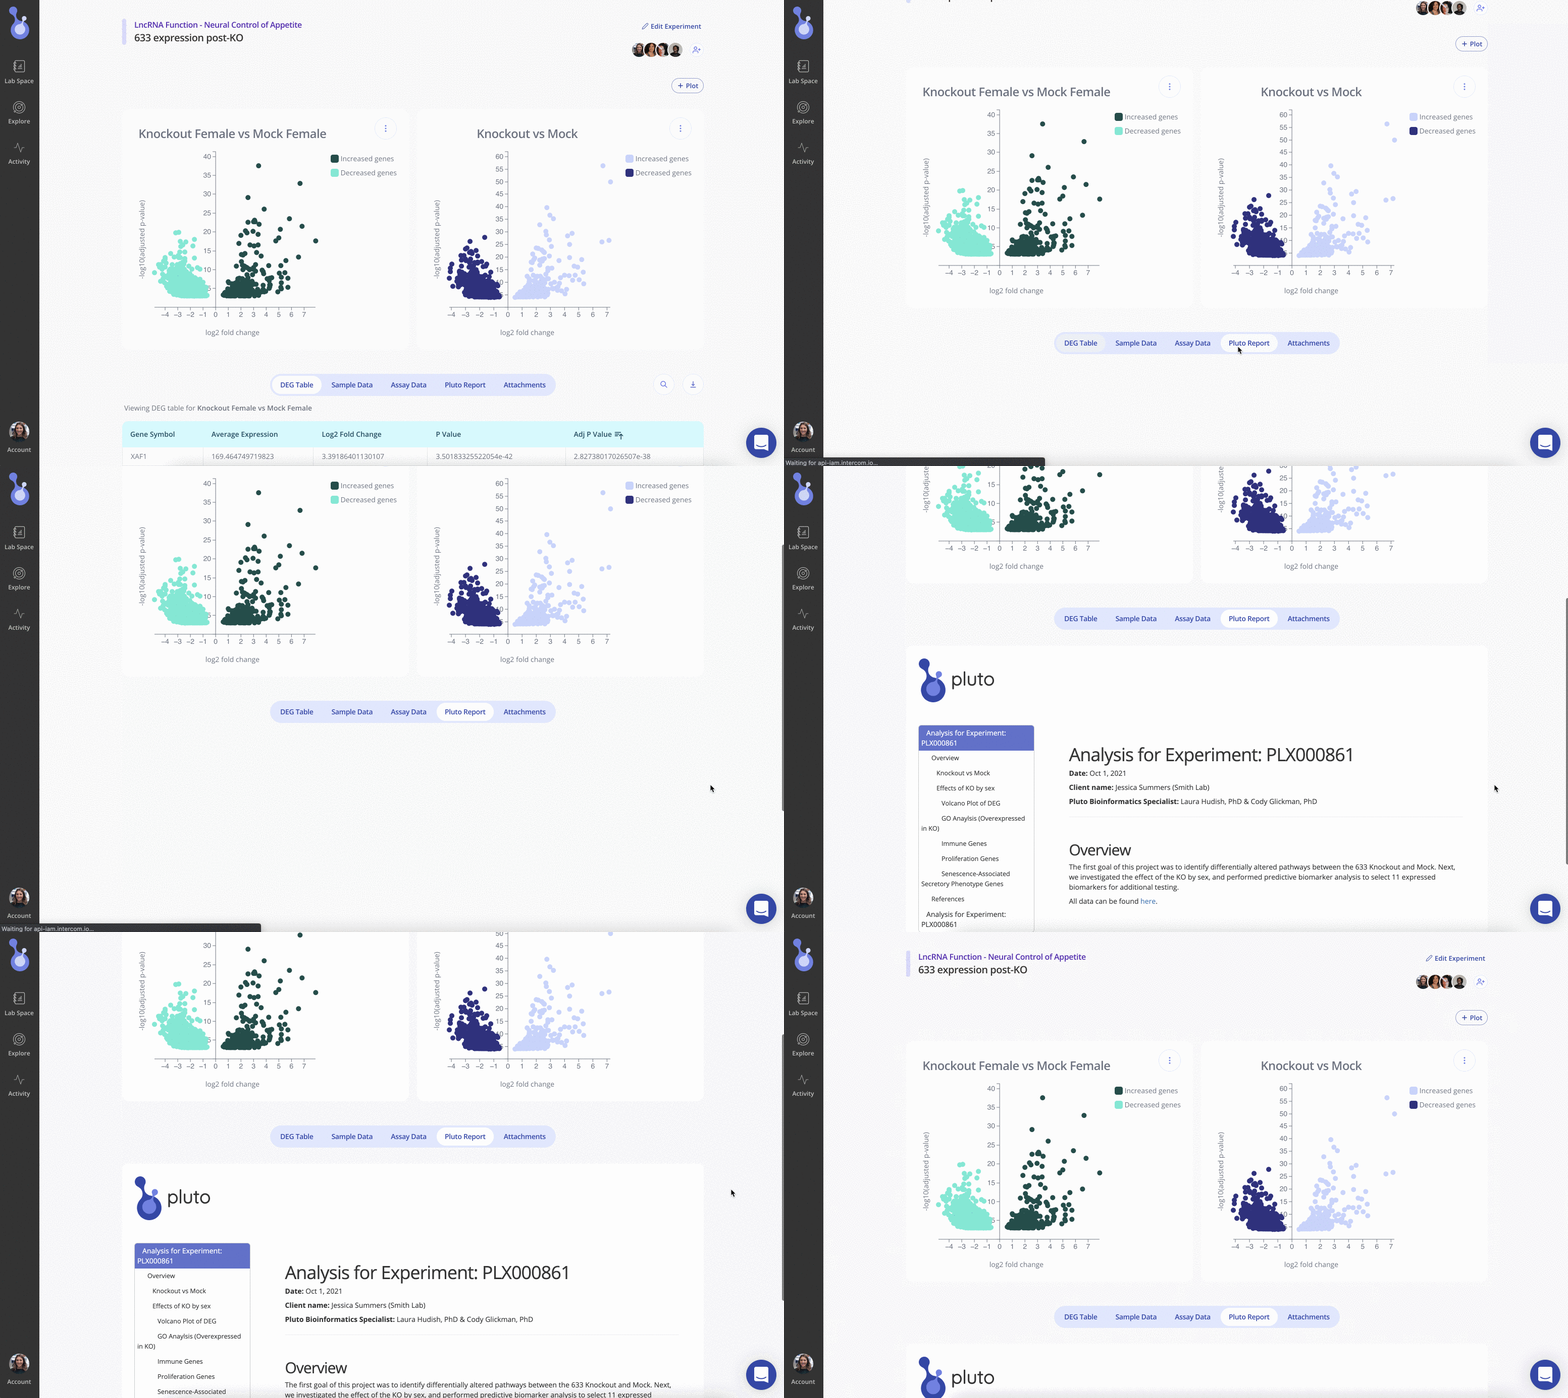
Reports are created and reviewed by our expert bioinformaticists, and are tailored to your precise experimental design.
Some of the custom analyses we commonly perform include:
-
Gene set enrichment analysis (KEGG, MSigDB, custom gene lists)
-
Pathway or GO term enrichment analysis
-
Predictive biomarker identification
-
Detailed plot customization (e.g. gene name labels, highlighting desired subsets of genes)
-
Meta-analysis across two or more experiments (can include public experiments from the Explore page)
-
And many more - just ask!
In addition to all of the analyses above, Pluto provides detailed QC reports for every RNA-seq experiment where FASTQ files were used as input. You can read about all of the RNA-seq analysis steps Pluto performs here.
