Use PCA dimensionality reduction to explore your data!
Step-by-step tutorial
Overview
Principal components analysis (PCA) is a commonly used technique to analyze large datasets by reducing dimensionality. PCA is used in exploratory analyses and can be useful for helping interpret your dataset. Through dimensionality reduction algorithms, sample information is condensed to five principal components, which represent a combination of all the variables into one score. The scores can then be plotted—clusters on the plot represent a group of samples that have similar scores, and therefore similar overall results.
The goal is to find the best summary of the data with a limited number of principal components. These principal components can help identify patterns in the data without prior reference to features of the sample such as phenotype, treatment or genotype.
Set up your analysis

-
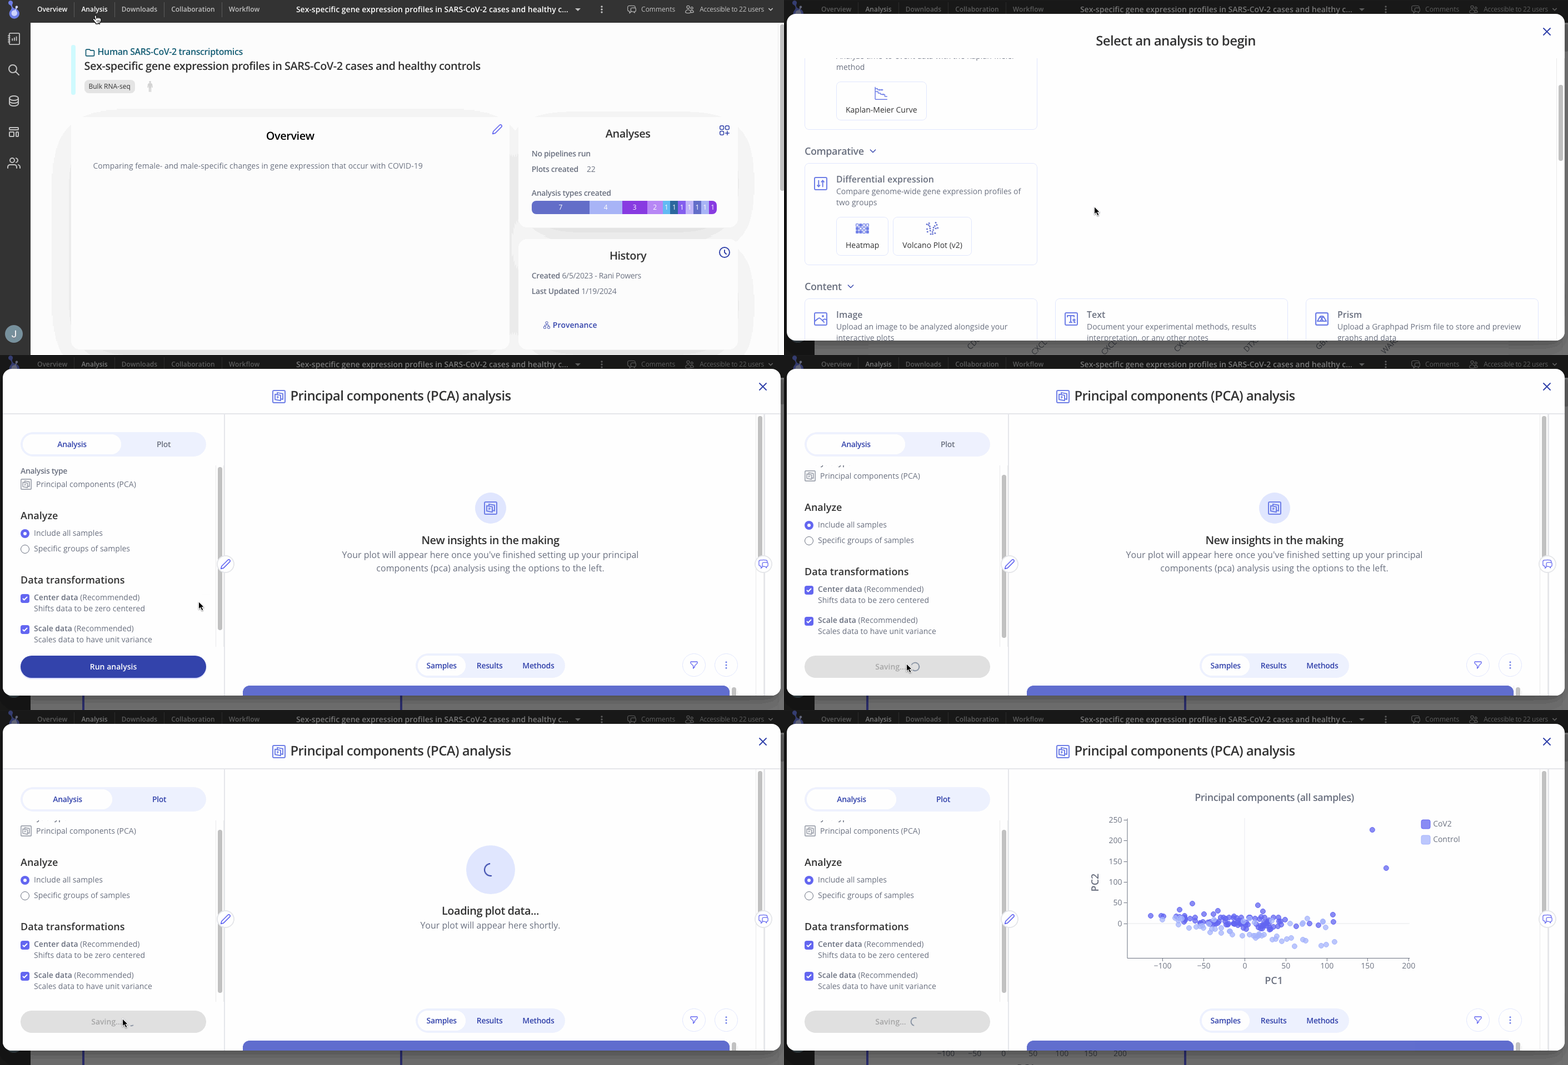
Navigate to your Analaysis tab within your experiment and click on +Analysis to get started.
-
Select whether or not you would like to include all of your samples in your analysis
-
If you would only like to analyze certain groups within your sample data, select the groups you would like to include
-
-
Choose whether or not to shift data so zero is at the center (recommended)
-
Choose whether or not to scale data so it has a unit variance (recommended)
-
Click the "Run Analysis" button to begin running principal components analysis with the parameters you set above.
Customize your plots
-
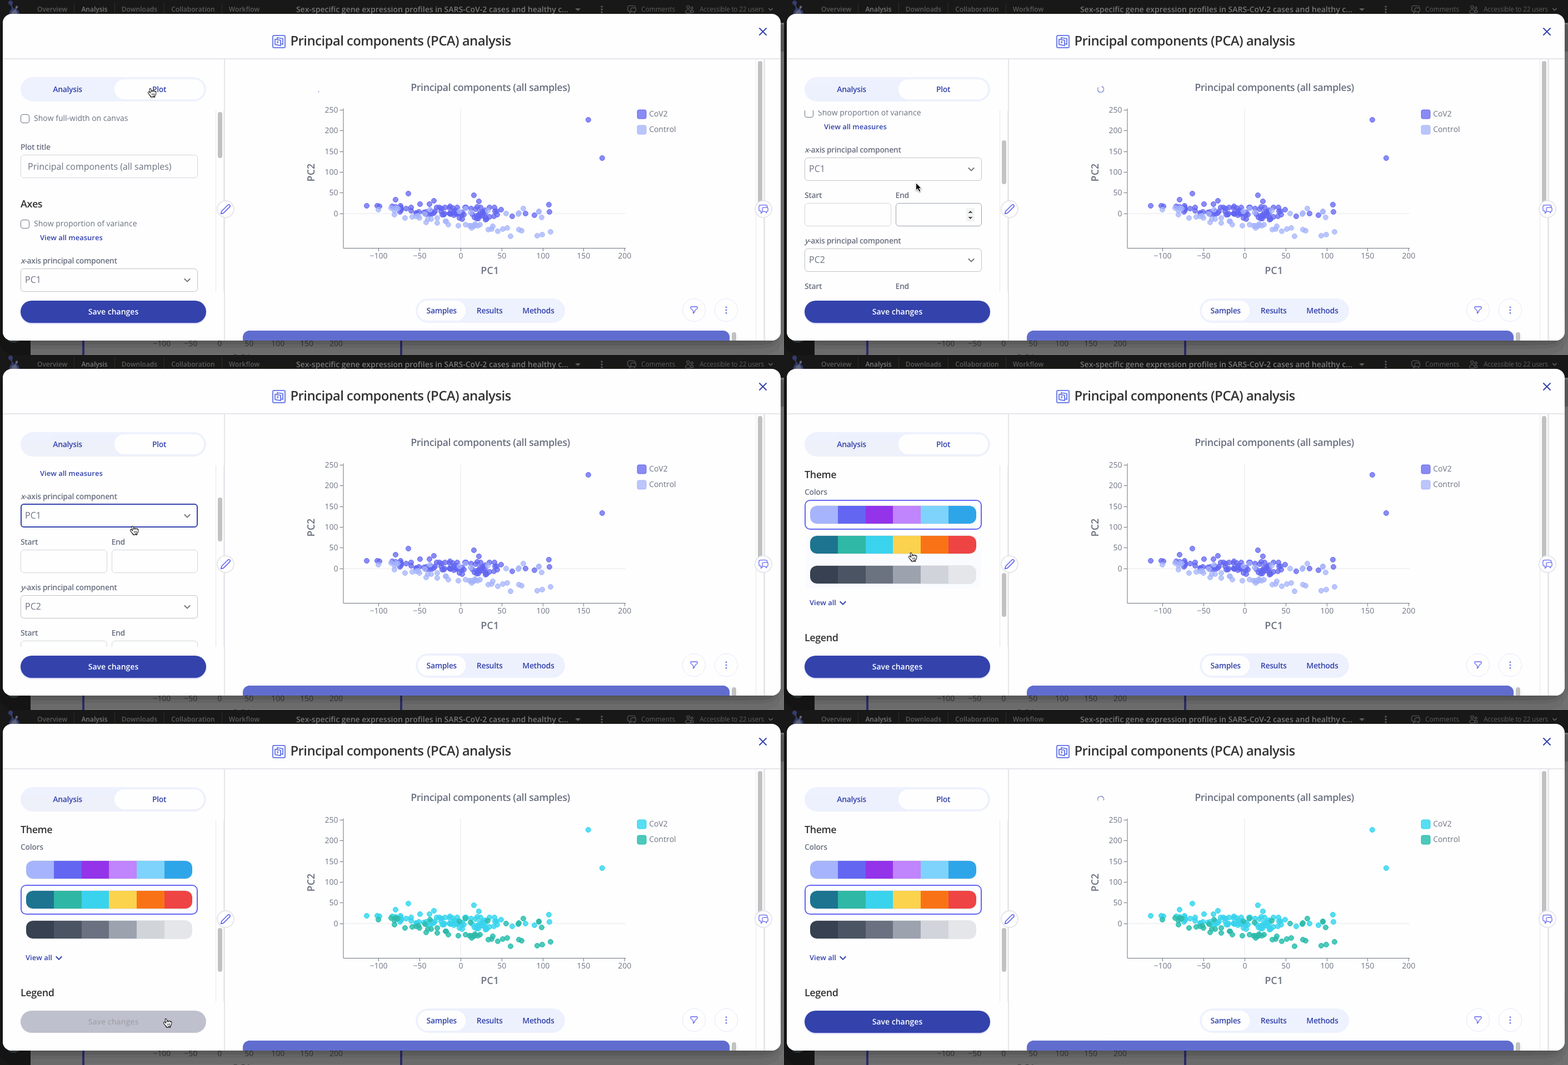
Use the Plot tab to customize the title, color palette, and legend.
-
Choose which principal components to analyze out of 5 options (PC1, PC2, PC3, PC4, or PC5 on x axis, same options for y axis).
-
Select which variables you'd like to use to group your points and customize other aspects of your plots.

