
Use the Pluto CUT&RUN pipeline with a .csv upload
Streamlined analysis for your CUT&RUN experiment to identify DNA-protein interaction sites.
1. Create Experiment
2. Upload sample and assay data
First, you'll add your assay data a as .csv file. You can upload that count matrix with consensus peaks using the "csv" tab.
Step 3. Add your sample annotations
Next you will add your sample annotations with a .csv file containing the sample IDs from your assay data. Here is an example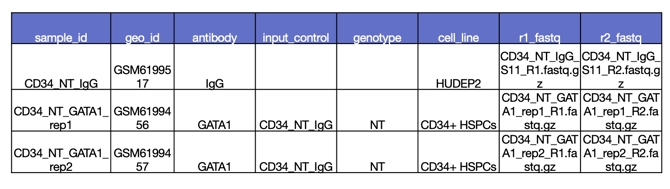
Step 4. Conduct Analyses
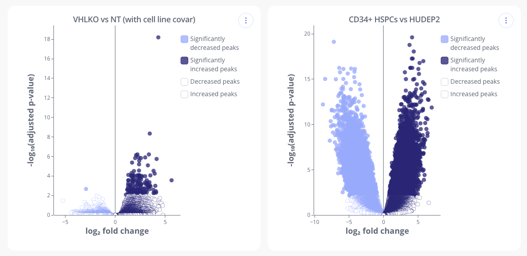
Head over to the analysis tab to start creating plots from your data. Below are a couple CUT&RUN plots you can make in Pluto.
- Differential Binding (Heatmap and Volcano plots)
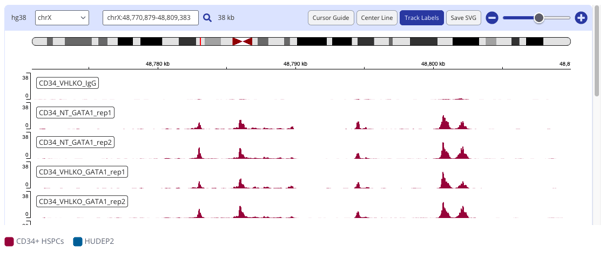
- IGV Peak plot
- Coverage (Tornado and Profile plots)
- Transcription Factor Enrichment analysis (Score Bar Plot)
- Gene Set Enrichment
- Summary Analysis (CPM normalized or raw values)
If you upload a .csv file for your assay data, you will not be able to generate Tornado, profile and IGV plots.