Coverage Analysis
Last updated: June 4, 2025
Visualize genomic sequencing coverage with two new plot types in Pluto
Coverage analysis allows for quick and straightforward visualization of read signal over genomic intervals, which is key for generating hypotheses from sequencing data sets (e.g., CUT&RUN, ChIP-seq, and ATAC-seq). Read or fragment alignments from BAM files are used to generate coverage tracks, which are useful for visualizing dense, continuous data and allow researchers to assess data quality, make comparisons between samples, and identify regions of interest and epigenetic marks.
This article highlights two new plot types now available in Pluto that provide more insight on your sequencing coverage!
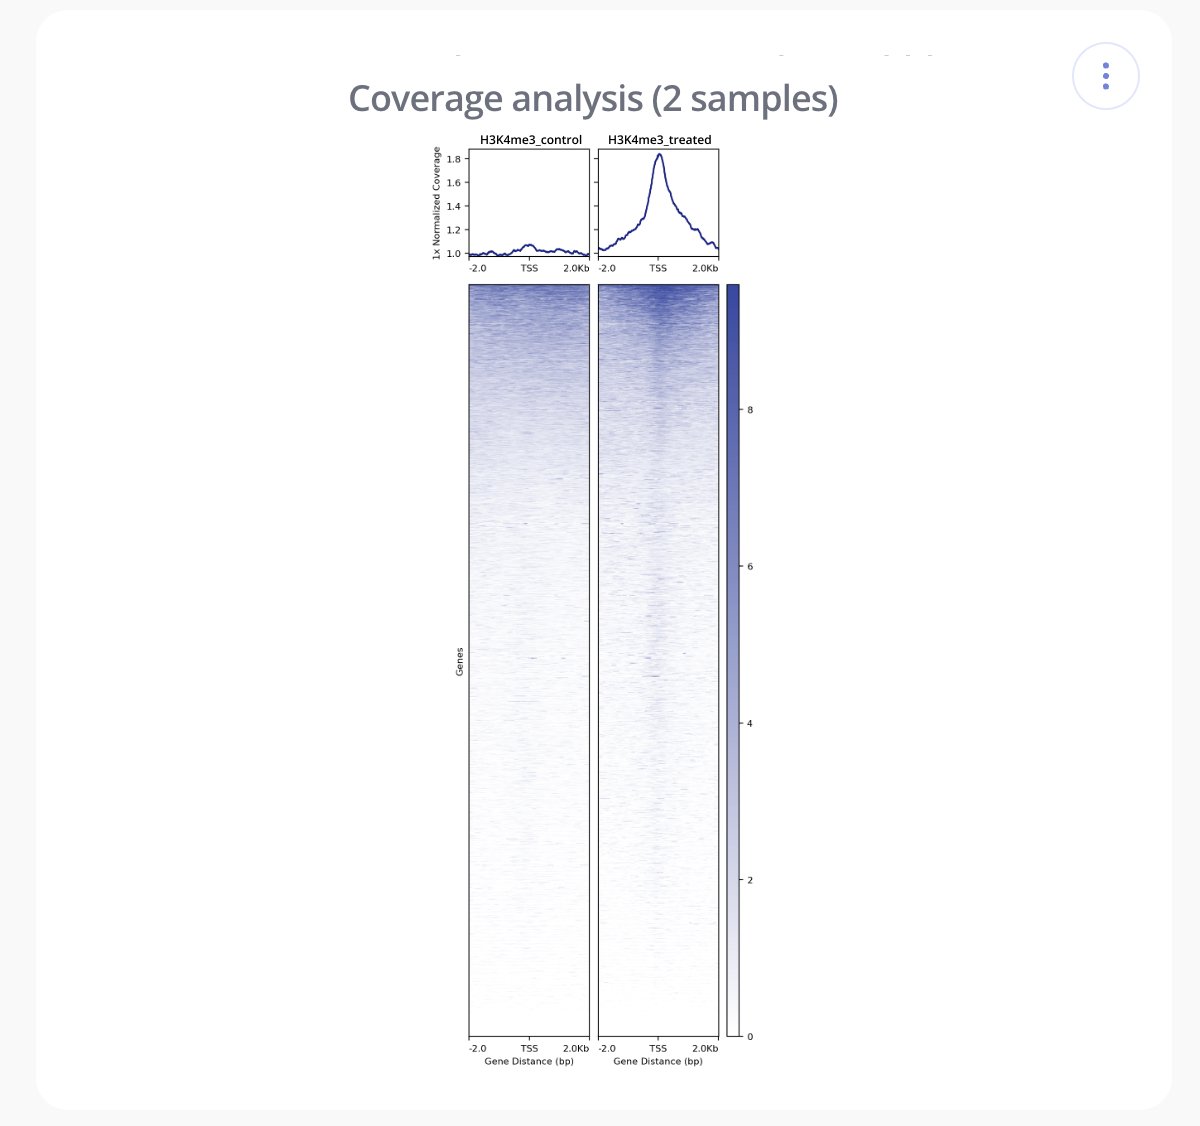
Tornado Plot - Tornado plots are a type of heatmap used to visualize scores associated with genomic regions across samples. The normalized depth of coverage is shown using a color-based scale. Each row in a tornado plot corresponds to a genomic locus, centered around the transcription start site (TSS) reference-point. Each column corresponds to a consecutive tile, measured in base pairs, relative to the center of the reference-point. Rows are arranged from high to low coverage, creating a tornado shape (thus, tornado plots!).
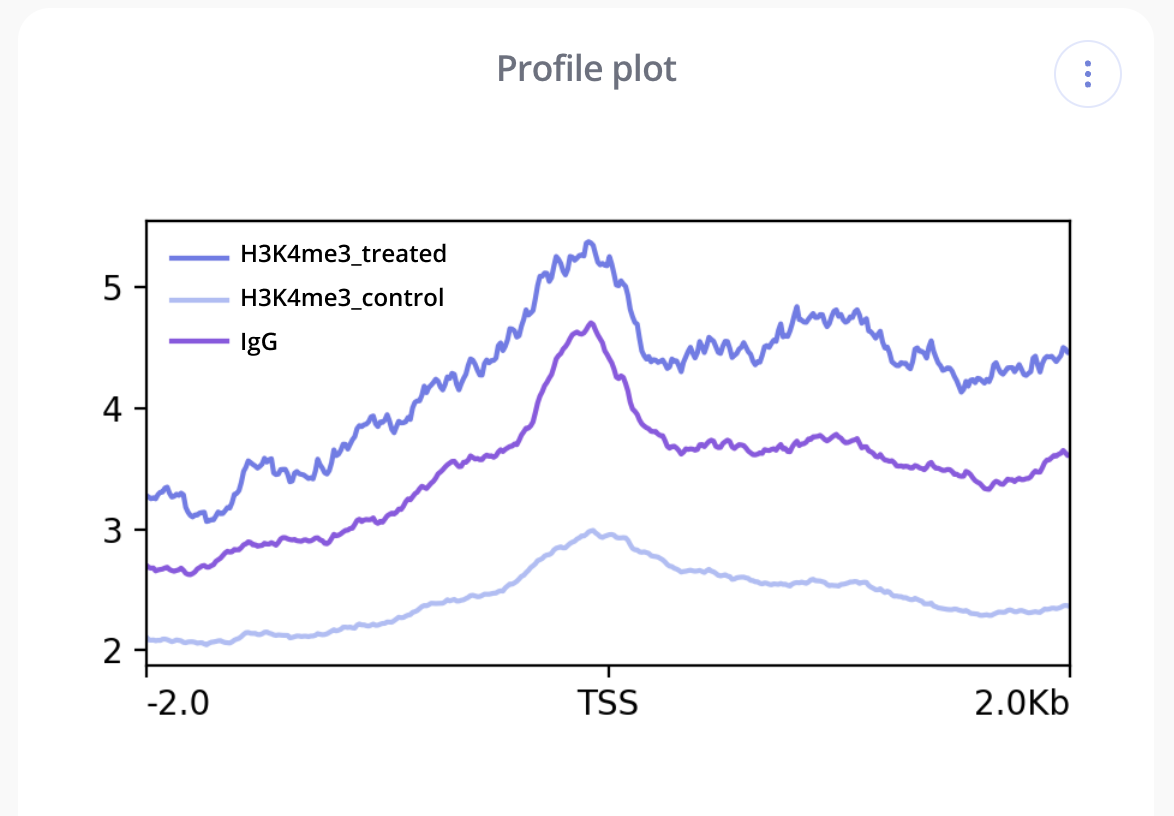
Profile Plot - Profile or Transcription Start Site (TSS) Overlap plots are essentially a density plot that show read density across all transcription start sites. Like with tornado plots, profile plots are used to visualize scores associated with genomic regions across samples. They can be helpful for identifying and comparing enrichment around the TSS between different samples in an experiment.
In Pluto, these visualizations are computed and created with the deepTools, a suite of Python tools developed for the efficient analysis of high-throughput sequencing data. For more information, click the "..." button in the upper right corner of one of your plots to view the methods for your coverage analysis.
References
Ramírez, Fidel, Devon P. Ryan, Björn Grüning, Vivek Bhardwaj, Fabian Kilpert, Andreas S. Richter, Steffen Heyne, Friederike Dündar, and Thomas Manke. "deepTools2: a next generation web server for deep-sequencing data analysis." Nucleic Acids Research (2016): gkw257.