Use counts per million (CPM) normalization for assay data measuring raw counts
Sequencing-based experiments can be affected by uneven sequencing depth across samples. To normalize for this when plotting assay data measuring raw counts, use the Summary (CPM-normalized) analysis.
CPM values are calculated by dividing the number of reads mapped to a gene by a million scaling factor divided by the total of mapped reads. CPM does not consider gene length when normalizing.
Running Summary Analysis (CPM-normalized) in Pluto
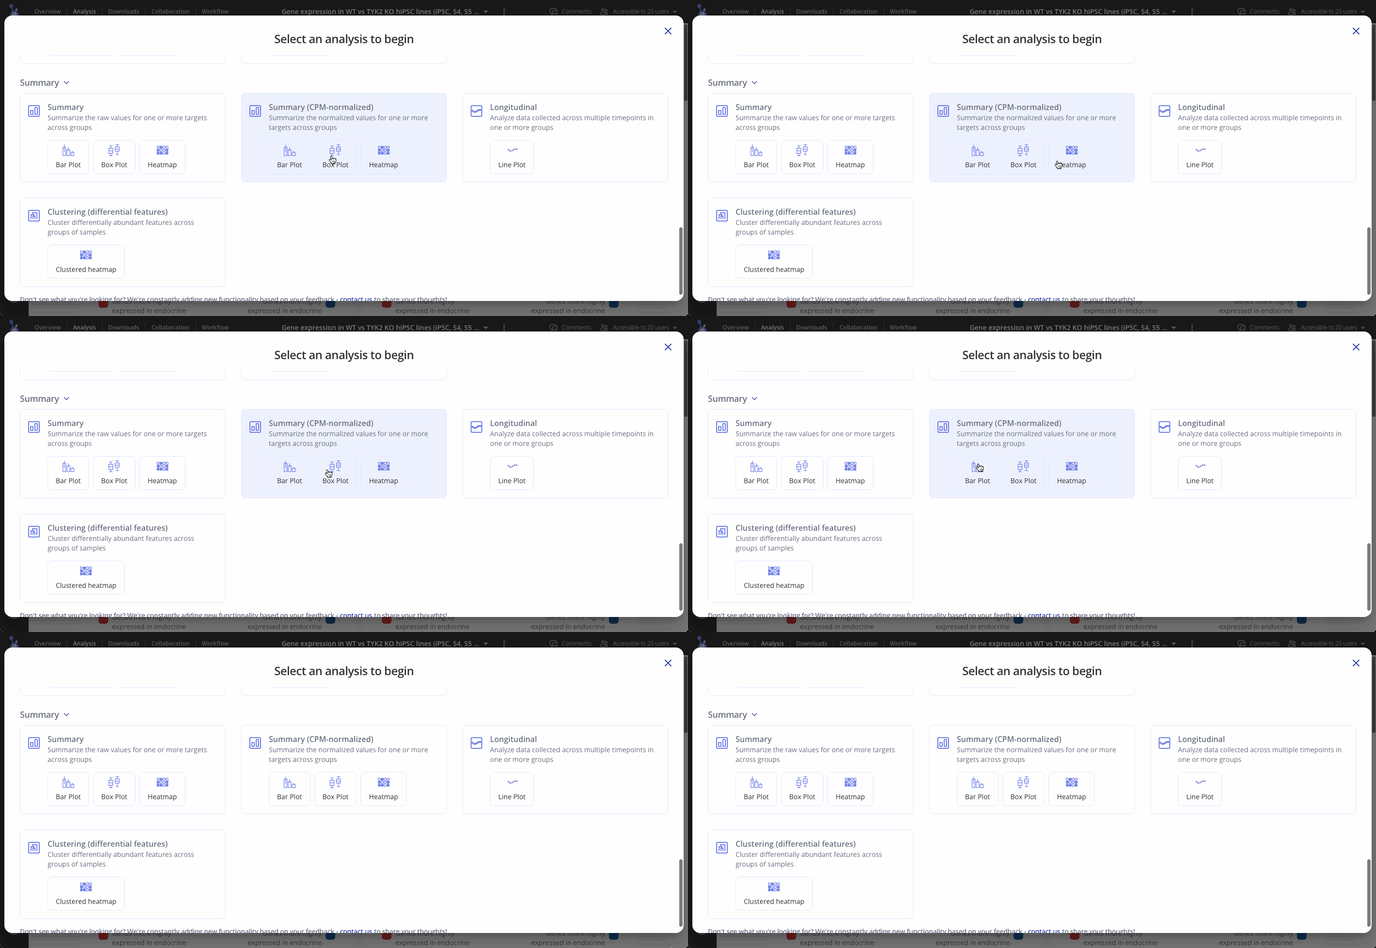
First, select + Analysis to open the analysis window and scroll down to Summary. Here you'll find three plot types to choose from.

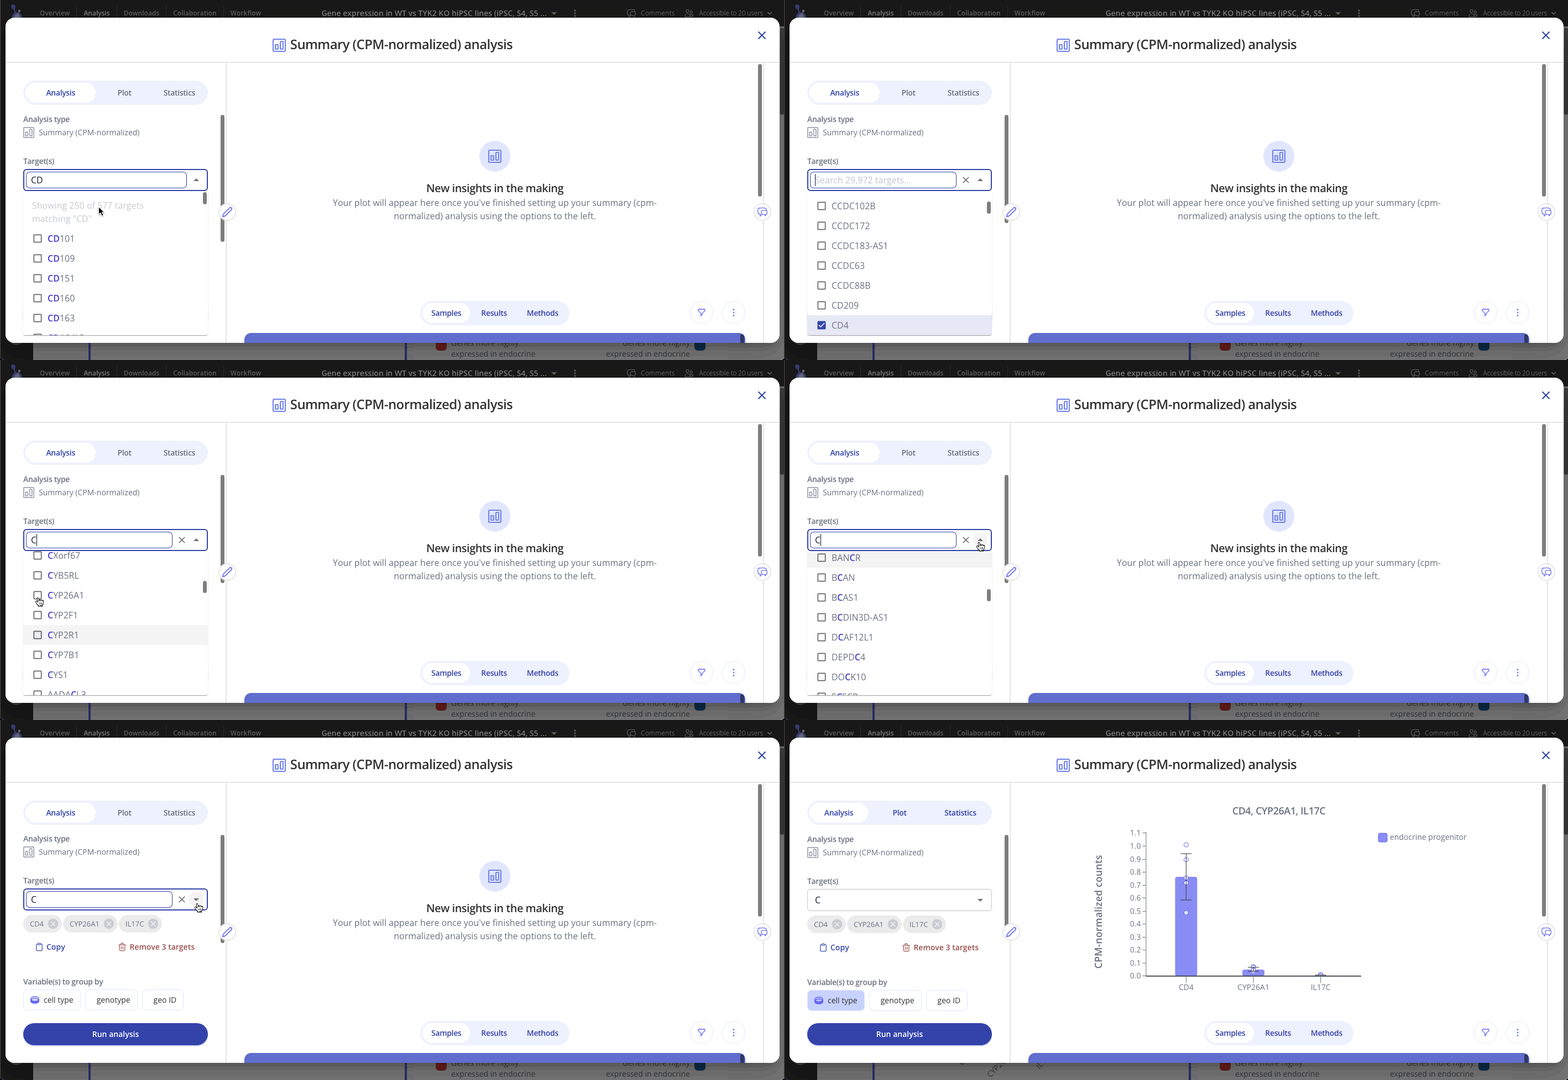
Select one or more targets to summarize, and choose one or more variables to group samples by. Click "Run Analysis" to perform counts per million (CPM) normalization on your raw count data.

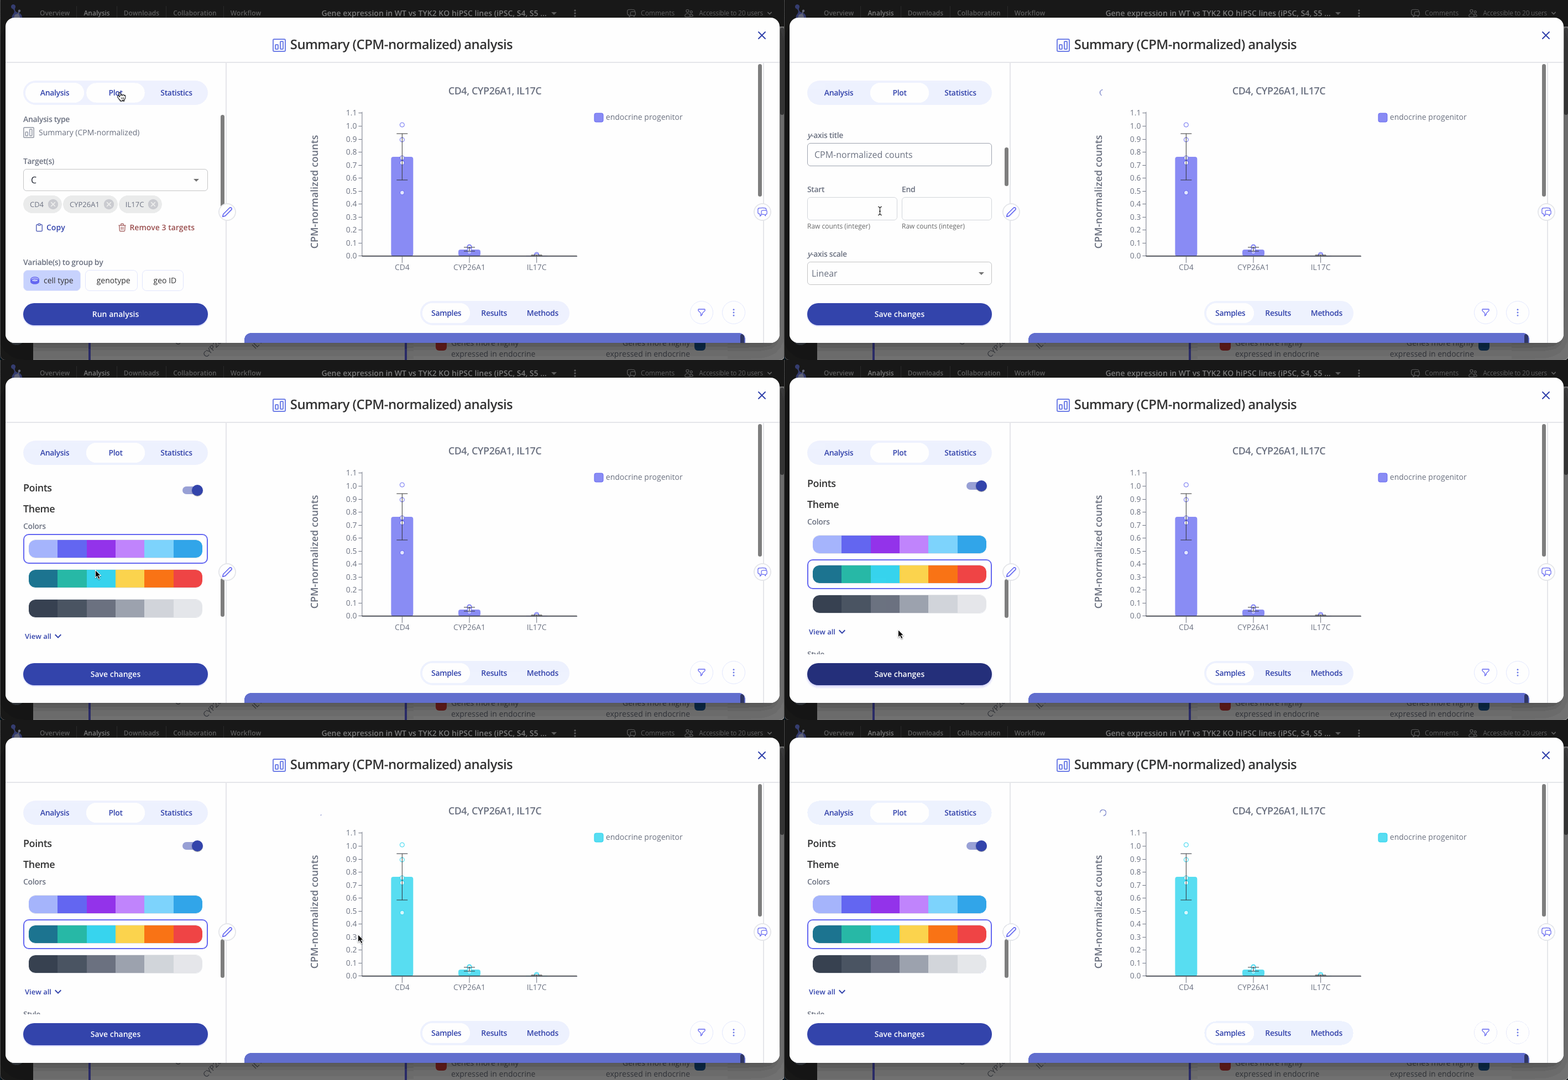
Navigate to the Plot tab to customize your plot and press "Save changes" when you're done to update your plot.

CPM-normalized data can be visualized with plots such as bar plots, boxplots, and heatmaps. Use the "Plot" tab in the sidebar to customize your visualization.
