Optionally integrate your single cell RNA-seq data
Written by Caitlin Winkler, PhD
Integrate is the fifth preprocessing step in the Preprocessing phase of the Experiment roadmap, and follows the Normalize step. Unlike the previous preprocessing steps, the Integrate step is optional.
During the Integrate step, you will decide if you would like to integrate your data or not. Integration might be necessary if your data shows unexpected variability across samples or groups of cells, which may be cause by using multiple datasets, batches, or by differences in sample source or processing. If you noticed during the Normalize step that your cells were grouping by sample or by experimental covariate, then integrating your data can enable more interpretable results during downstream analyses.
However, integration is not always necessary. For example, if your samples and experimental covariates were evenly distributed in low-dimensional space during the Normalize step, or if your data is from a single batch and there are minimal technical variations, you can skip integrating your data.
If you decide to integrate your data, we offer three different integration methods that you can pick from: Harmony (1), Reciprocal Principal Component Analysis (RPCA) (2, 3), and Canonical Correlation Analysis (CCA) (2, 3).
Running the preprocess
To run the Integrate preprocess, you will first select whether or not you would like to integrate your data. If you decide to integrate your data, you will select which integration method to use as well as what covariate(s) you would like to integrate over. Similar to the Normalize step, if you decide to integrate your data you will also have options to set parameters related to dimensionality reduction and visualization.
Once you've selected your parameters, click Run preprocessing step. Feel free to navigate away from the modal window while the preprocess is running; you will get an email notification once the preprocess has successfully completed and you are able to move on to the next step.
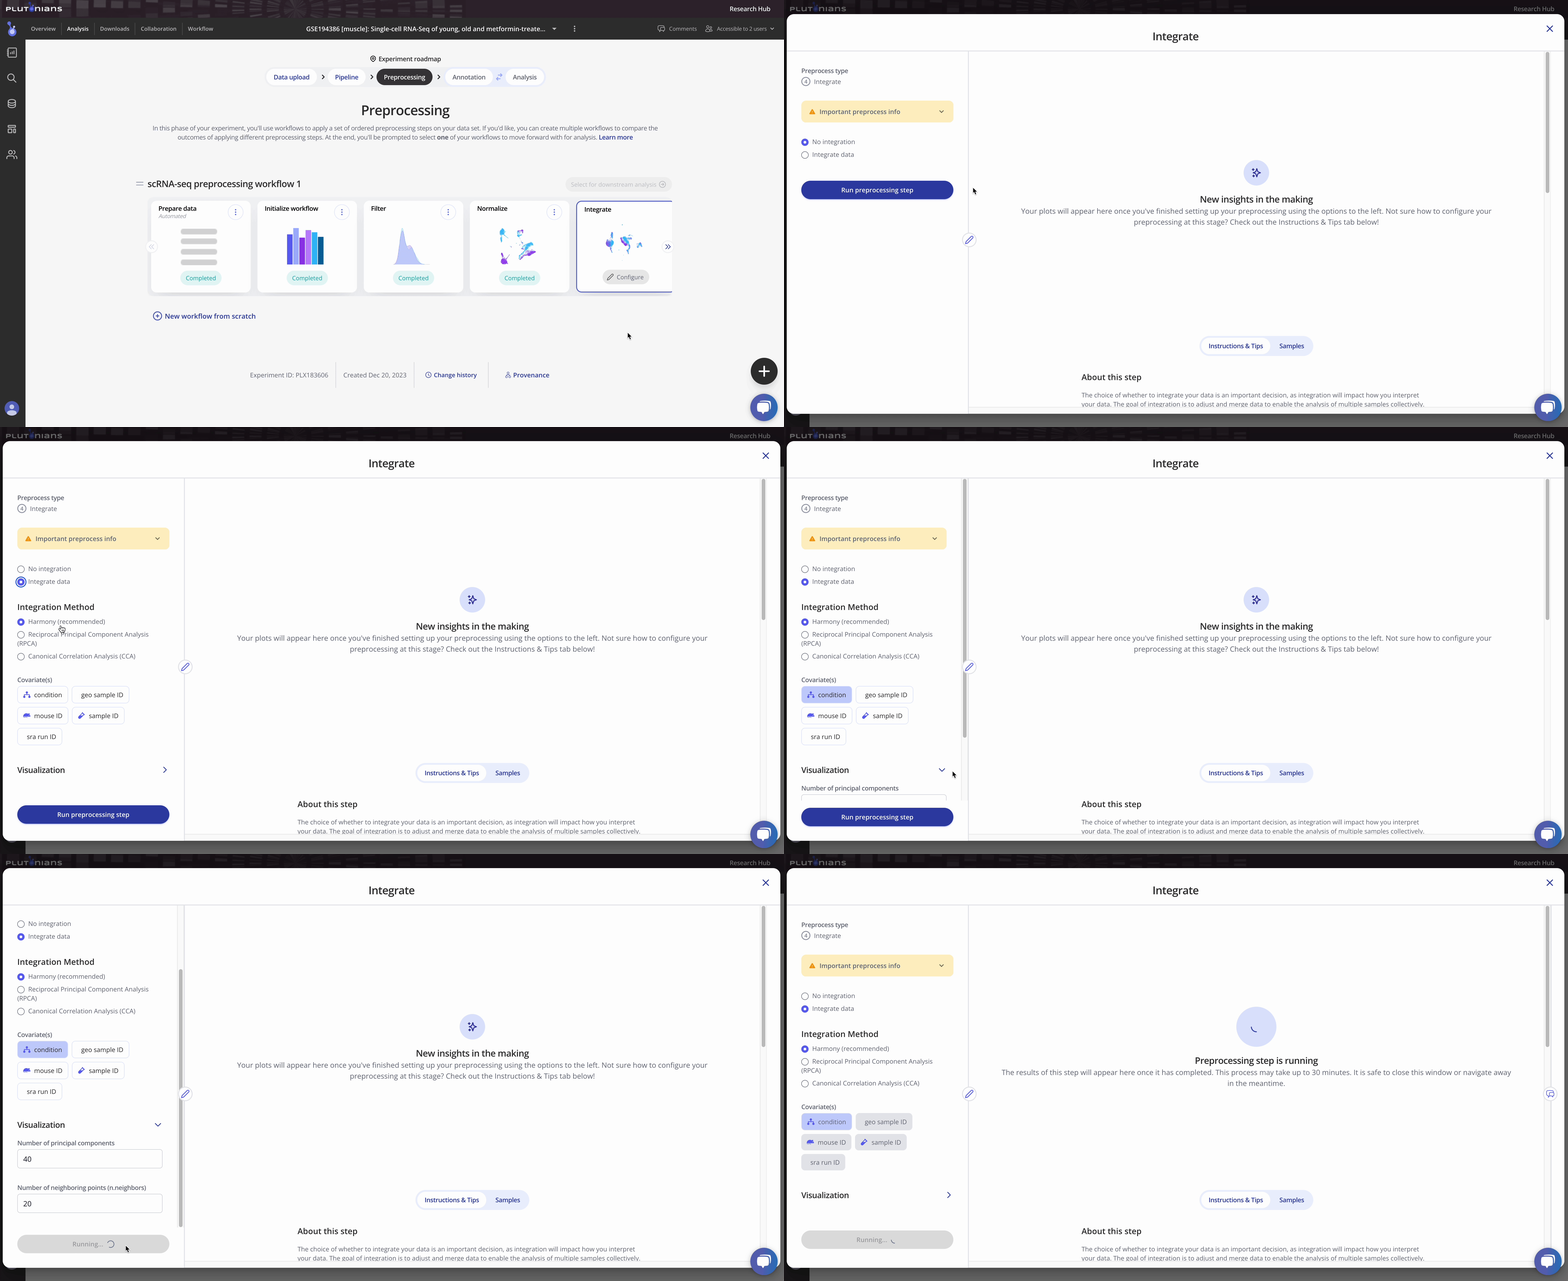
Check out the Instructions & Tips tab in the modal window for more information about the preprocess, as well as recommendations on what to consider when integrating your data.
With all single cell RNA-seq preprocesses, your sample-level metadata is readily available for reference within the modal window under the Samples tab.
Navigating the results
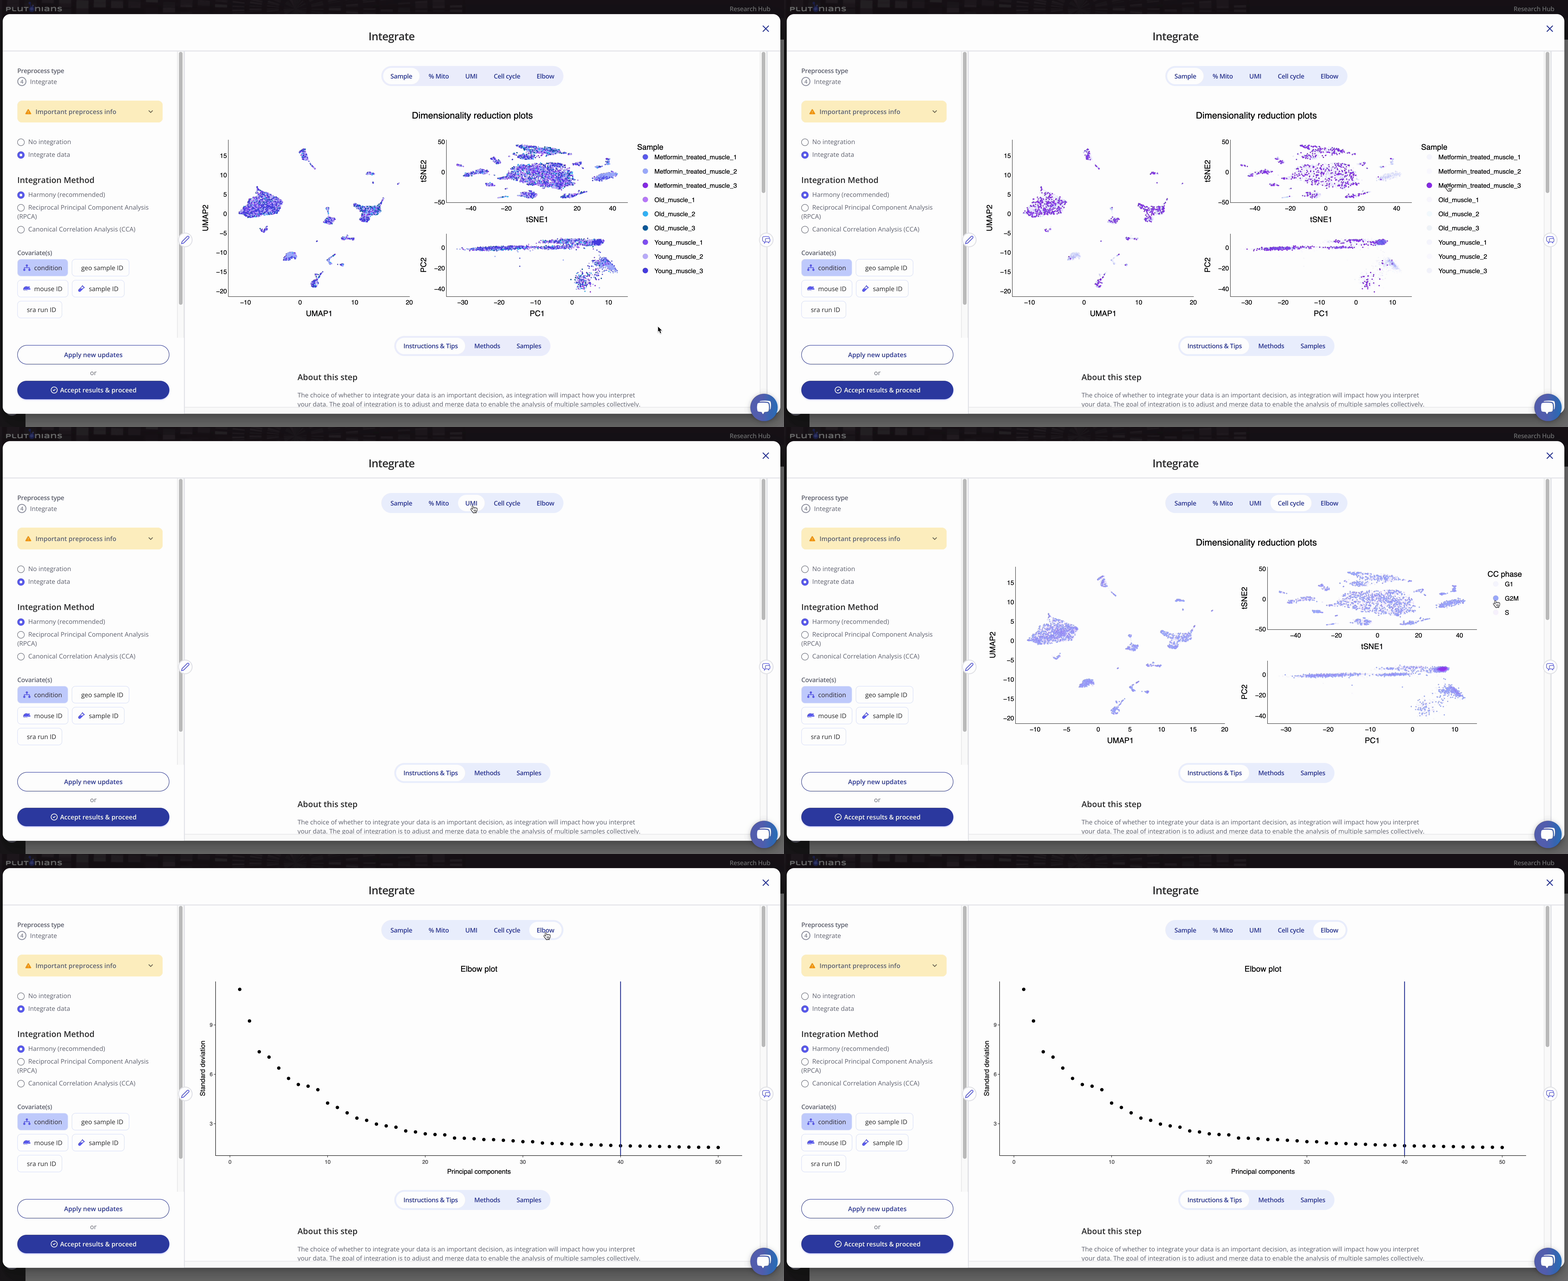
The Integrate step returns several plots that you can review. Most plots are interactive. For the categorical dimensionality reduction plots (Sample and Cell cycle), you can toggle between groups of cells by clicking on the legend (one click will highlight the sample, and clicking the sample again will return the plot to the original view). For the Elbow plot, you can hover over the individual points for more info. The continuous dimensionality reduction plots (% Mito and UMI) are not interactive.
Accepting the results
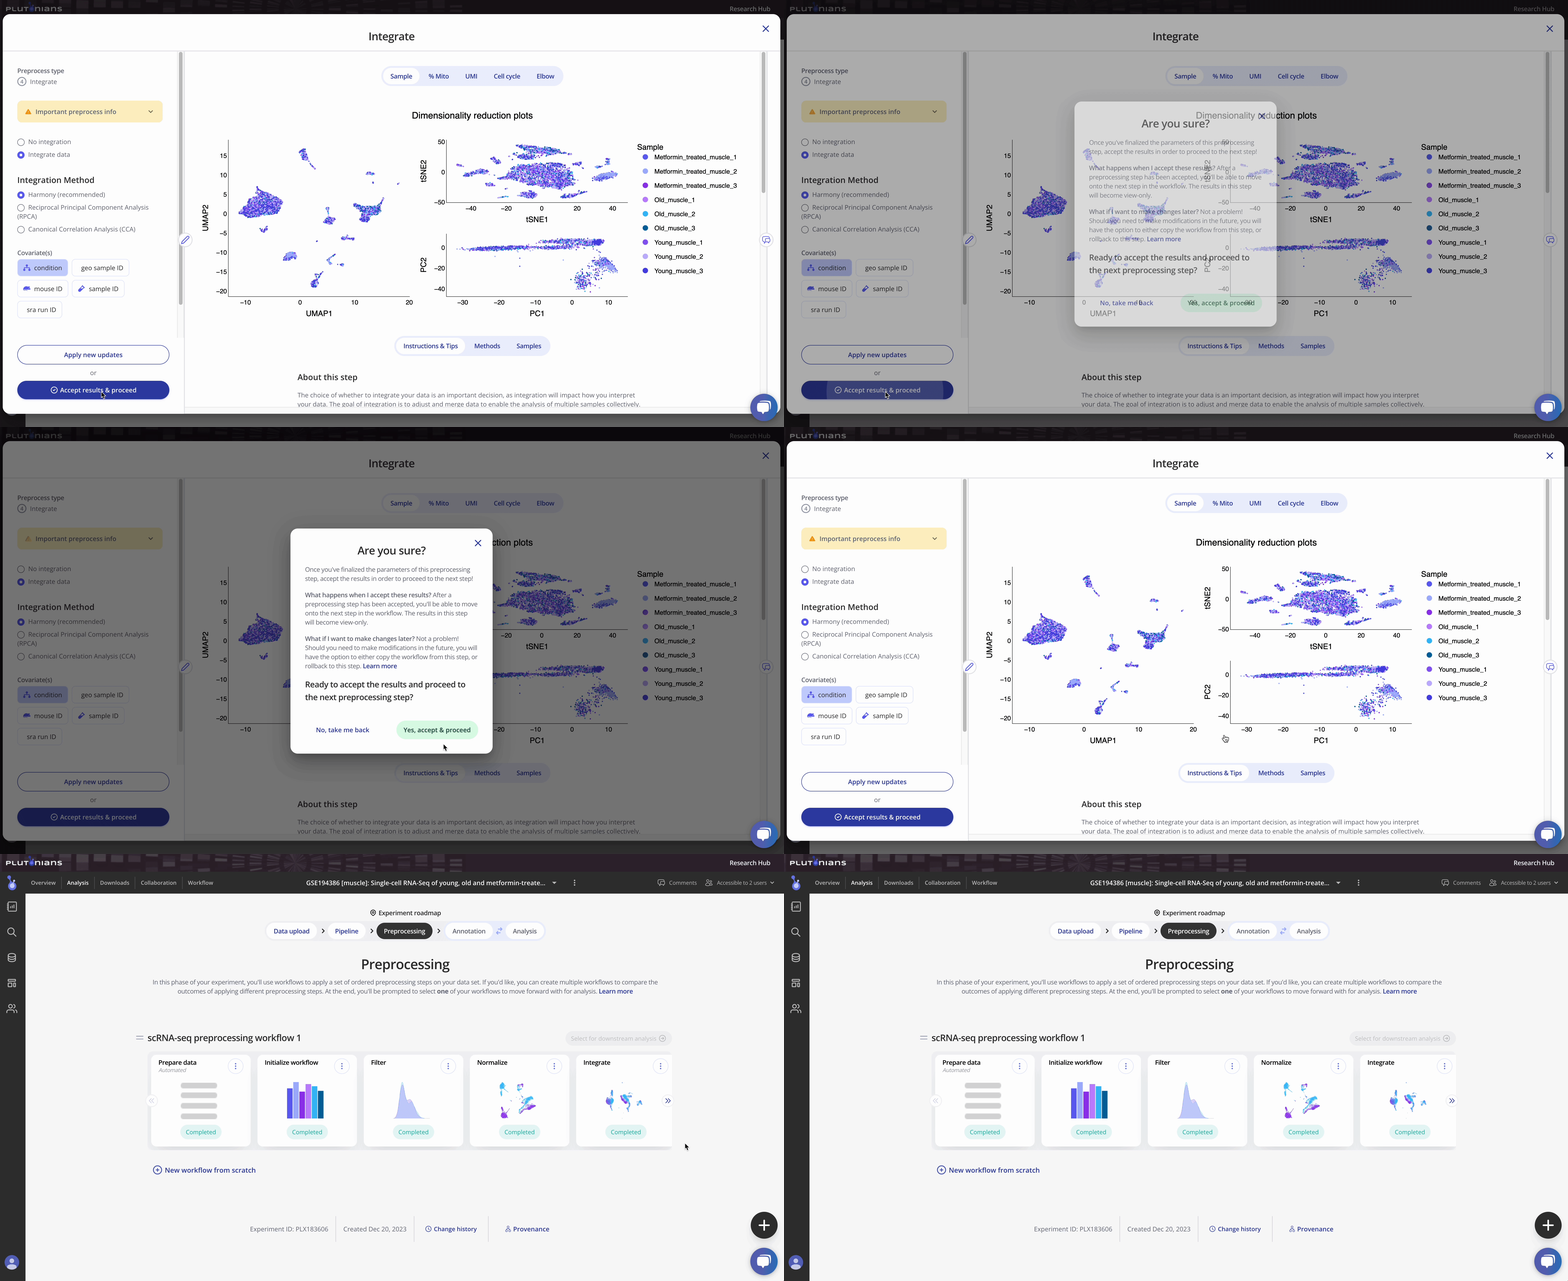
If you need to or want to change any of the preprocess parameters, you can rerun the process by updating your parameters and clicking the Apply new updates button. Once you are ready to move on to the next preprocessing step in the workflow, click Accept results & proceed. This will pop-up an additional confirmation window, where you can click Yes, accept & proceed to continue on with the workflow or No, take me back if you would like to keep modifying the Integrate step.
What's next?
After you have successfully completed the Integrate step, you will move on to the Cluster preprocess. Clustering is the process of grouping similar cells together based on their gene expression patterns, and helps to identify cell types and phenotypes that are present in your data.
References
- Korsunsky et al. Fast, sensitive and accurate integration of single-cell data with Harmony. Nature Methods (2019). doi: 10.1038/s41592-019-0619-0
- Hao and Hao et al. Integrated analysis of multimodal single-cell data. Cell (2021). doi: 10.1016/j.cell.2021.04.048
- Stuart and Butler et al. Comprehensive Integration of Single-Cell Data. Cell (2019). doi: 10.1016/j.cell.2019.05.031
