Cluster your single cell RNA-seq data to identify different cell types
Written by Caitlin Winkler, PhD
Cluster is the sixth preprocessing step in the Preprocessing phase of the Experiment roadmap, and follows the optional Integrate step.
During the Cluster step, you will cluster your Seurat object. Clustering is the process of grouping similar cells together based on their gene expression patterns. Clusters are defined by cluster resolutions, which are different levels of magnification with which you can examine your data. You can cluster your cells at different levels of detail: a lower resolution will create larger, global clusters (fewer clusters overall) with more cells in each cluster, and a higher resolution will create smaller, more granular clusters (more clusters overall) with less cells in each cluster.
Lower cluster resolutions give a broad view of cell types or major cell groups in the data, and are useful when you want to quickly identify the main cell populations you are working with. Higher cluster resolutions provide a more detailed view, helping you to identify subtypes of cells or finer distributions within a broad cell type. This can be important when you want to understand the heterogeneity within a cell population.
During the Cluster step, you will also be able to explore the top marker genes for each cluster. Marker genes are crucial in identifying and characterizing cell clusters in single cell RNA-seq data. Marker genes are genes that are specifically expressed in particular cell types or clusters, making them an excellent starting point for distinguishing and characterizing these cell populations.
Running the preprocess
To run the Cluster preprocess, you will first select up to four different clustering resolutions. You can additionally change or select different parameters related to how the marker genes will be identified, as well as parameters for dimensionality reduction and visualization.
Once you've selected your parameters, click Run preprocessing step. Feel free to navigate away from the modal window while the preprocess is running; you will get an email notification once the preprocess has successfully completed and you are able to move on to the next step.
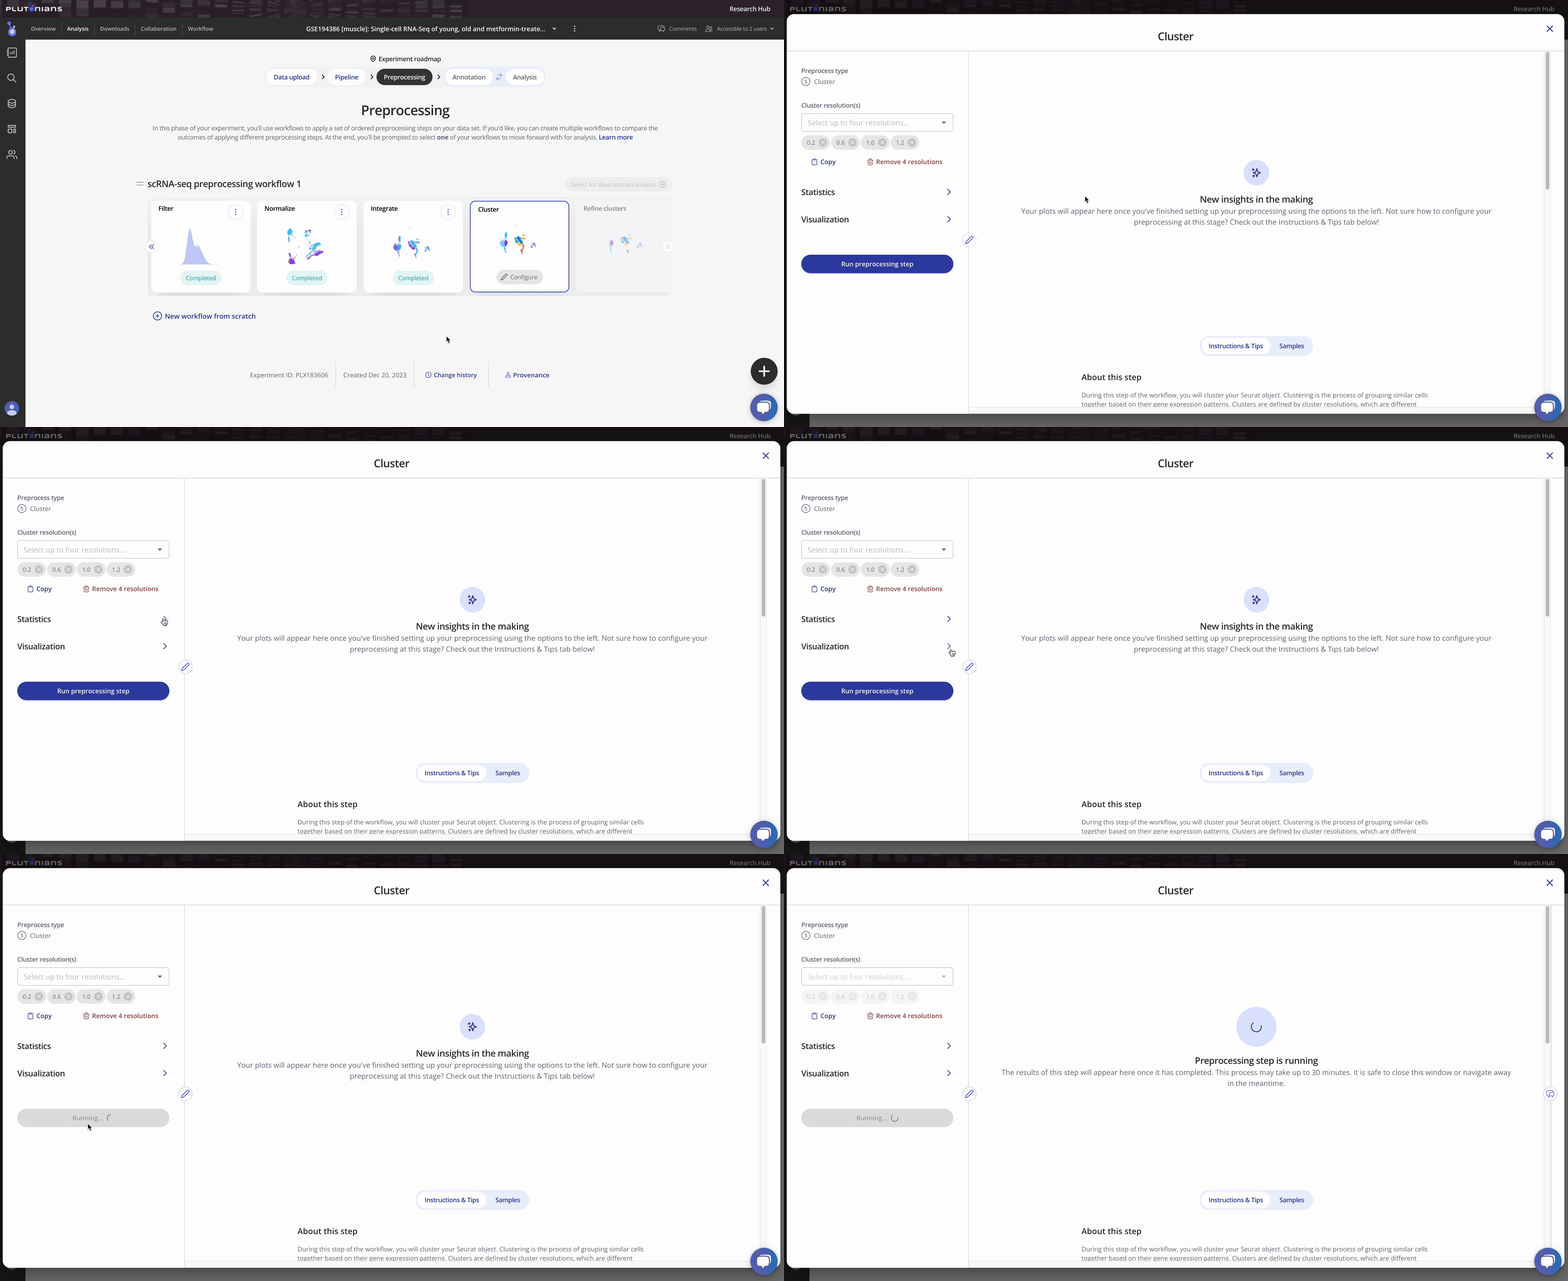
Check out the Instructions & Tips tab in the modal window for more information about the preprocess, as well as recommendations on what to consider when clustering your data.
With all single cell RNA-seq preprocesses, your sample-level metadata is readily available for reference within the modal window under the Samples tab.
Navigating the results
The Cluster step returns several plots and results tables for each resolution that you can review. Most plots are interactive, and all results tables are downloadable.
For the dimensionality reduction plot(s) (Dim plot), you can toggle between different clusters by clicking the legend (one click will highlight the cluster, and clicking the cluster again will return the plot to the original view). The Results tab shows the marker genes identified per cluster.
The Dot plot is not interactive, but is scrollable, and highlights the top 3 marker genes identified per cluster. The Results tab shows the marker genes identified per cluster (this is the same results table as when viewing the Dim plot).
<insert gif here>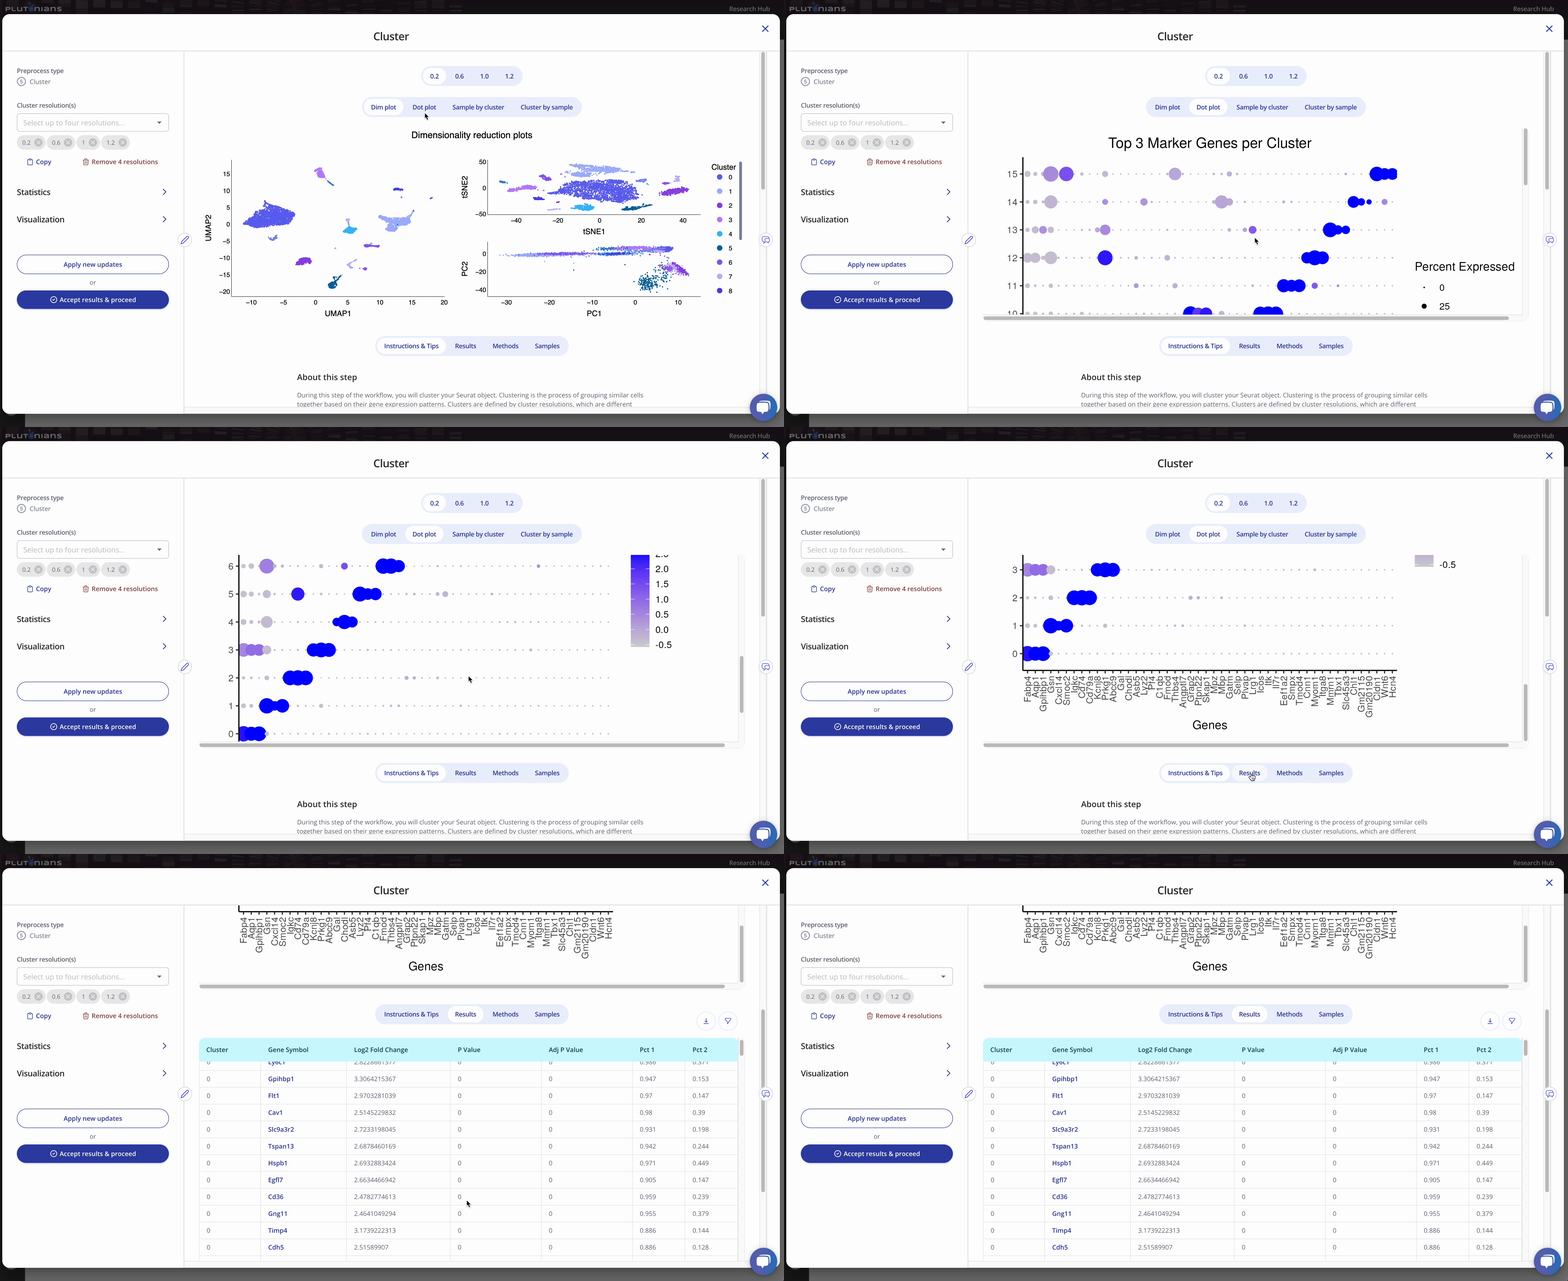
The Sample by cluster composition plot is interactive. You can hover over the bars to get additional composition info. You can also toggle between different clusters by clicking on the legend (one click will hide the cluster, a double-click will isolate the cluster; click or double-click on the cluster or sample again to return the plot to the original view). The Results tab shows the tabular results used to generate the Sample by cluster composition plot.
Similar to the Sample by cluster composition plot, the Cluster by sample composition plots is also interactive. You can hover over the bars to get additional composition info, and toggle between different samples by clicking on the legend (one click will hide the sample, a double-click will isolate the sample; click or double-click on the sample again to return the plot to the original view). The Results tab shows the tabular results used to generate the Cluster by sample composition plot.
Accepting the results
If you need to or want to change any of the preprocess parameters, you can rerun the process by updating your parameters and clicking the Apply new updates button. Once you are ready to move on to the next preprocessing step in the workflow, click Accept results & proceed. This will pop-up an additional confirmation window, where you can click Yes, accept & proceed to continue on with the workflow or No, take me back if you would like to keep modifying the Cluster step.
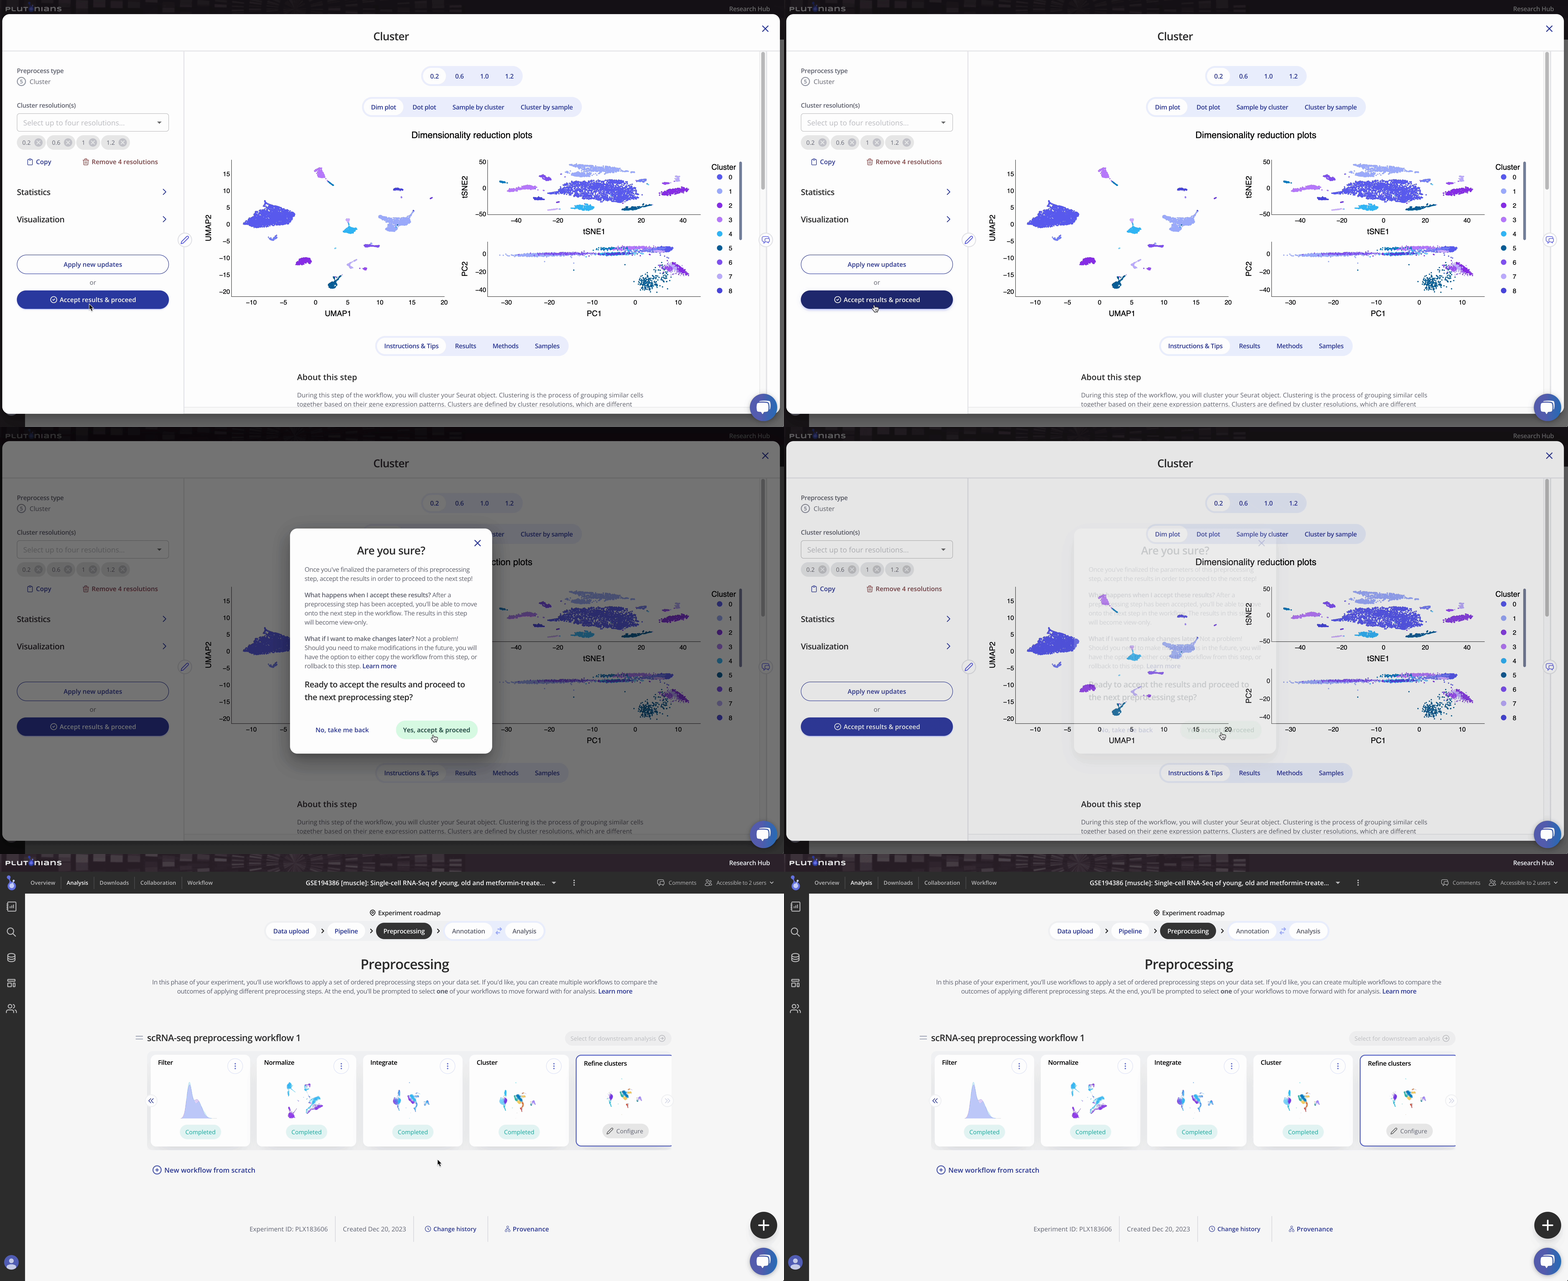
What's next?
After you have successfully completed the Cluster step, you will move on to the Refine clusters preprocess, which is the final preprocess step and is optional. The Refine clusters step allows you to refine your data and remove cluster(s) from your data before finalizing your workflow and proceeding to downstream analysis.
