Filter your single cell RNA-seq data to remove low-quality and outlier cells
Written by Caitlin Winkler, PhD
Filter is the third preprocessing step in the Preprocessing phase of the Experiment roadmap, and follows the Initialize workflow step.
Filtering is an essential quality control step in single cell analysis to ensure the reliability and accuracy of your data. During the Filter step, you will remove low-quality cells from your data. You will also have the option to remove doublets/multiplets and even remove entire samples if necessary.
Running the preprocess
The Filter preprocess is run automatically following completion of the Initialize workflow step using default parameters. Once the initial run of the Filter preprocess is complete, several QC metrics plots will be available for you to review and use to define filtering thresholds that make sense for your unique data set. Feel free to navigate away from the modal window while the preprocess is running; you will get an email notification once the preprocess has successfully completed and you are able to move on to the next step.
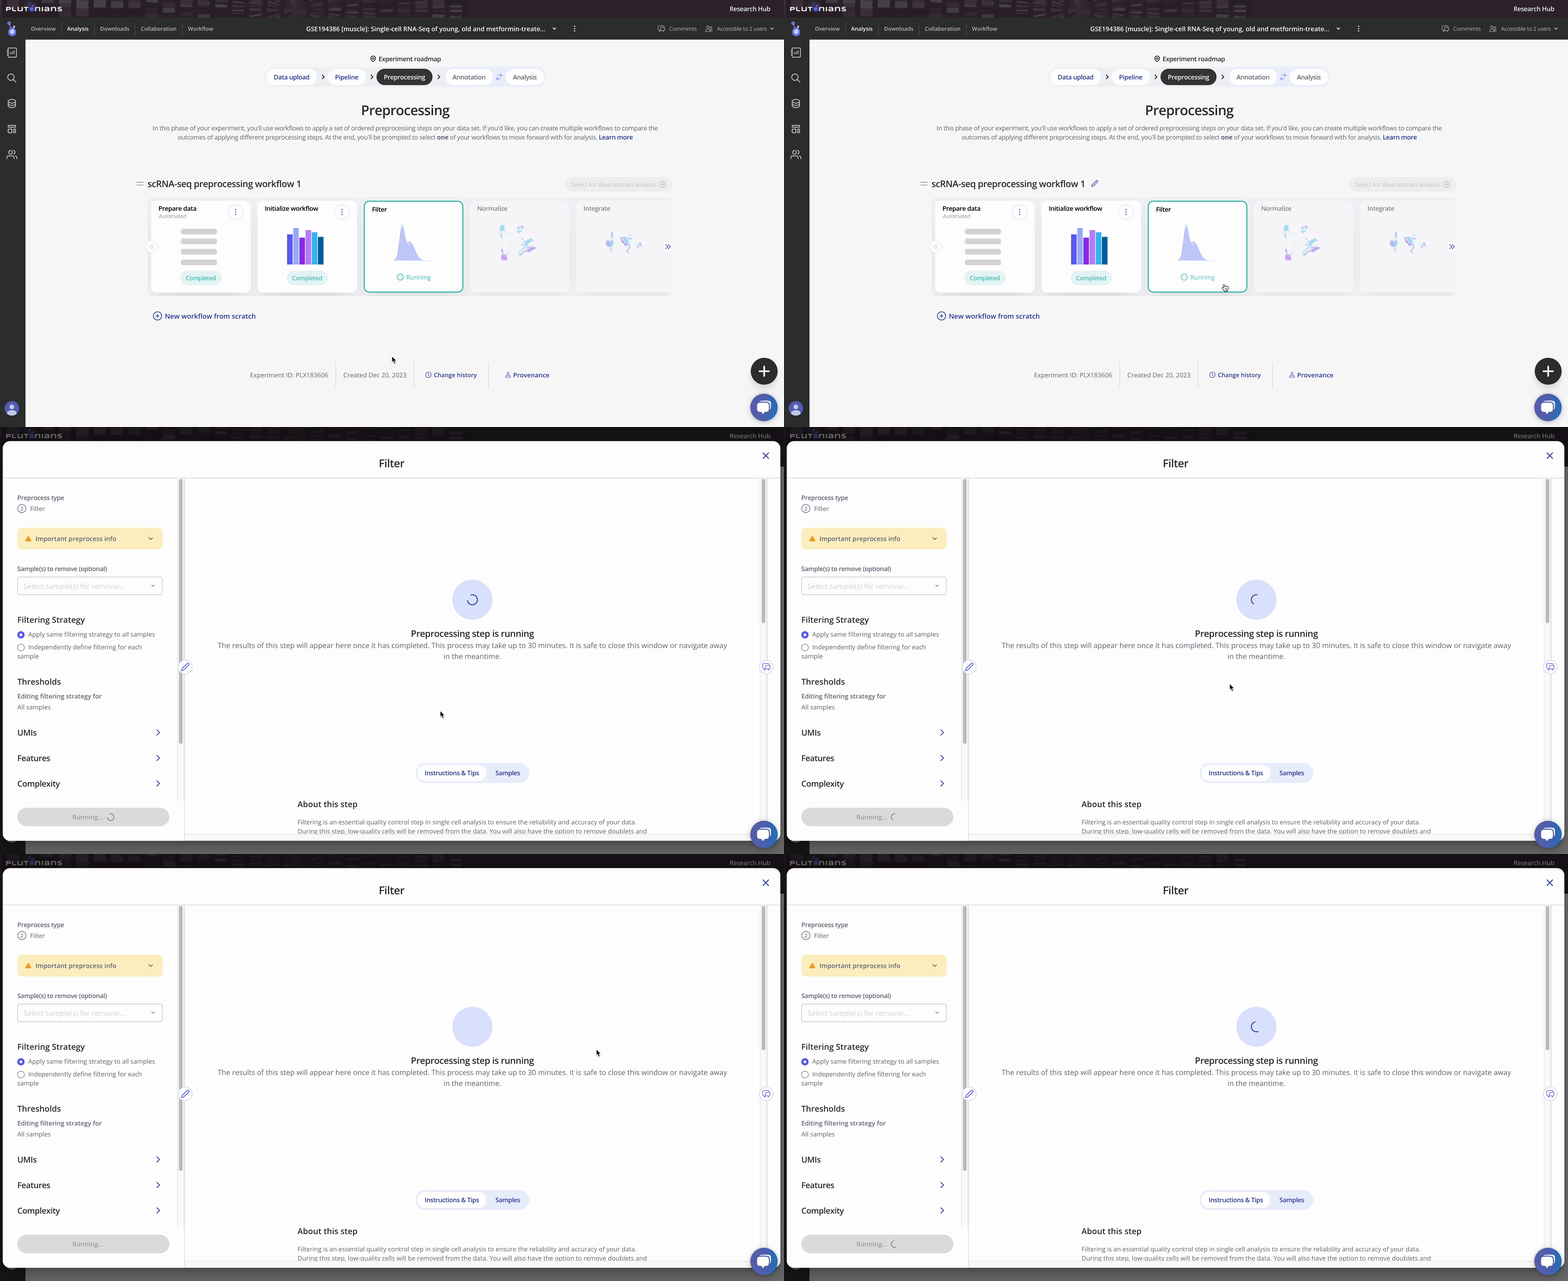
Check out the Instructions & Tips tab in the modal window for more information about the preprocess, as well as recommendations about how to set appropriate filtering thresholds.
With all single cell RNA-seq preprocesses, your sample-level metadata is readily available for reference within the modal window under the Samples tab.
Navigating the results
The Filter step returns several QC plots that you should assess to determine appropriate filtering thresholds for your data. The QC plots are generated using the unfiltered data. The lines in the QC plots represent the filtering thresholds selected for the different filtering categories. Thus, the QC plots offer a visual representation of what cells will be included in and excluded from the data moving forward. Note that if you elect to remove any samples from your data that this will not be reflected in the QC plots - but rest assured that the samples are removed and will not be included in any downstream preprocessing or analyses!
All kernel plots are interactive. You can hover over the curves to get additional info and toggle between samples by clicking on the legend (one click will hide the sample, a double-click will isolate the sample; click or double-click on the sample again to return the plot to the original view). The vertical lines in the kernel plots represent the filtering thresholds.
The joint plot is not interactive, but is scrollable (depending on the number of samples in your data set). The purple vertical and horizontal lines represent the minimum and maximum UMIs and Features filtering thresholds.
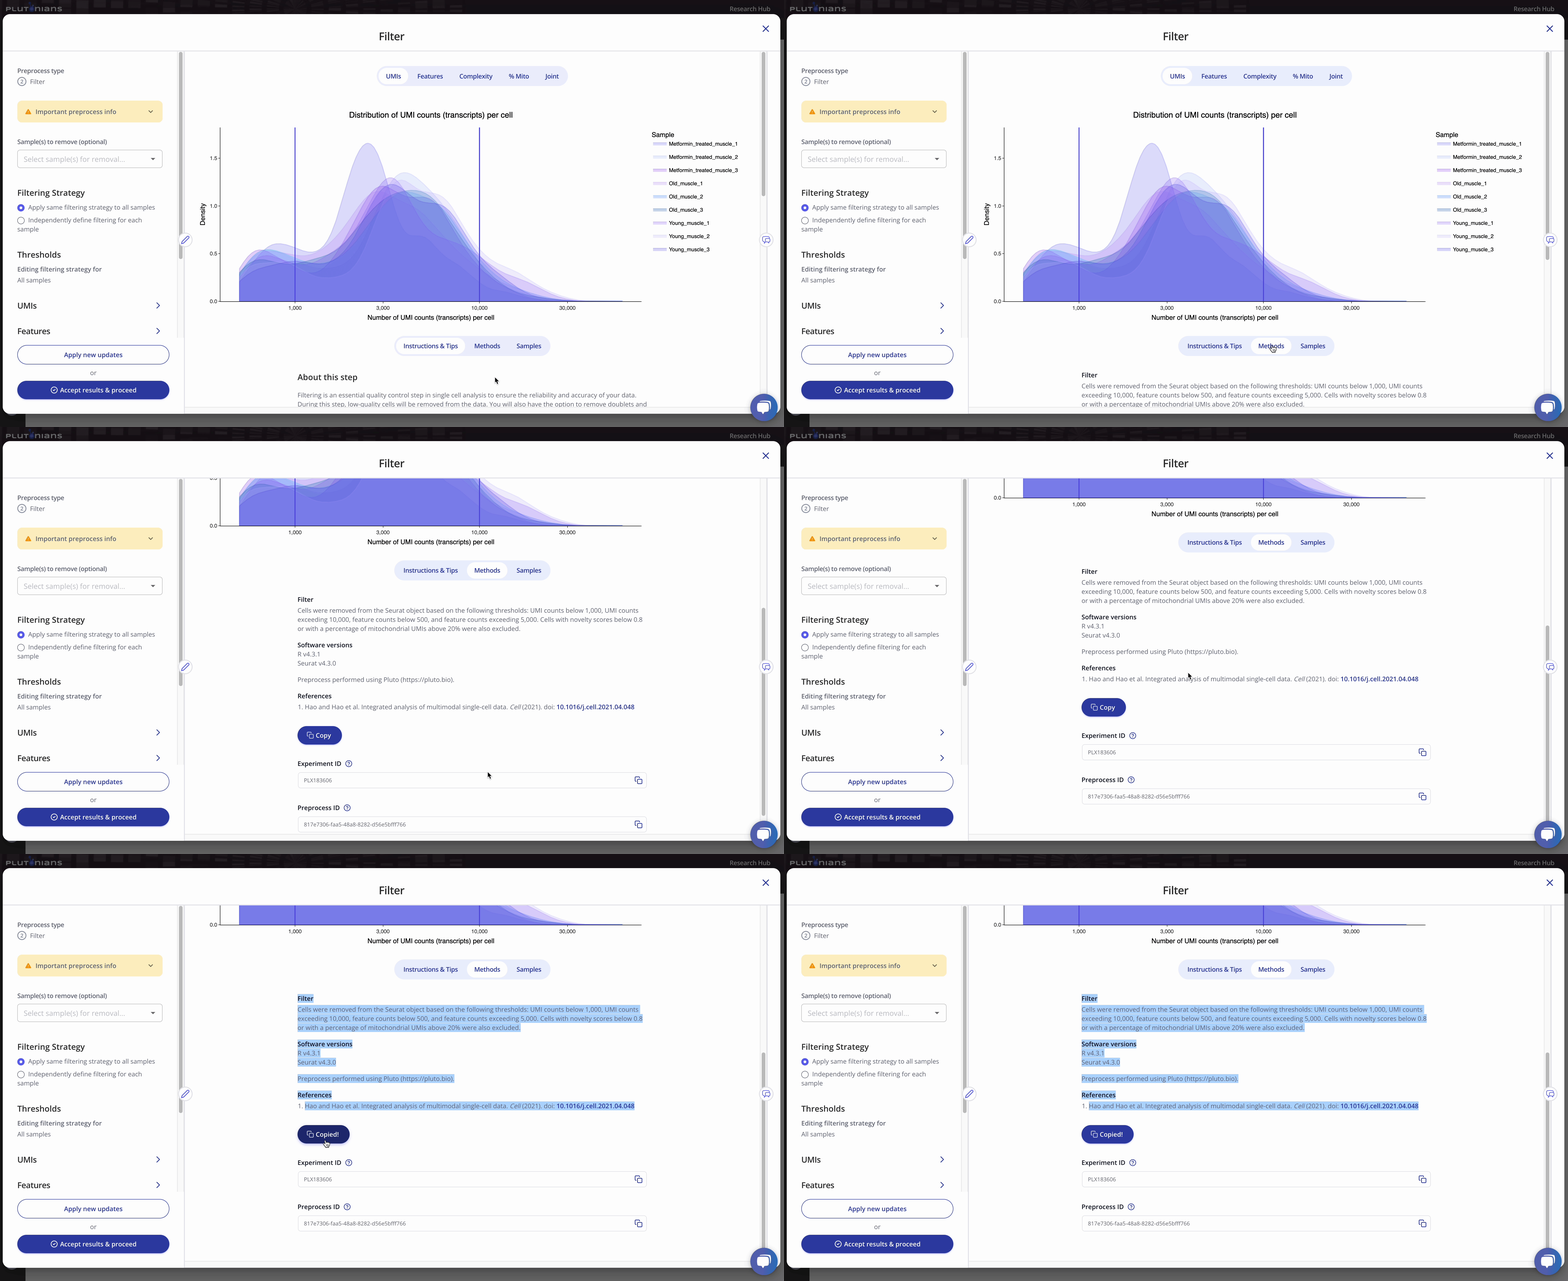
You can also find the methods related to your preprocess run under the Methods tab.
Accepting the results
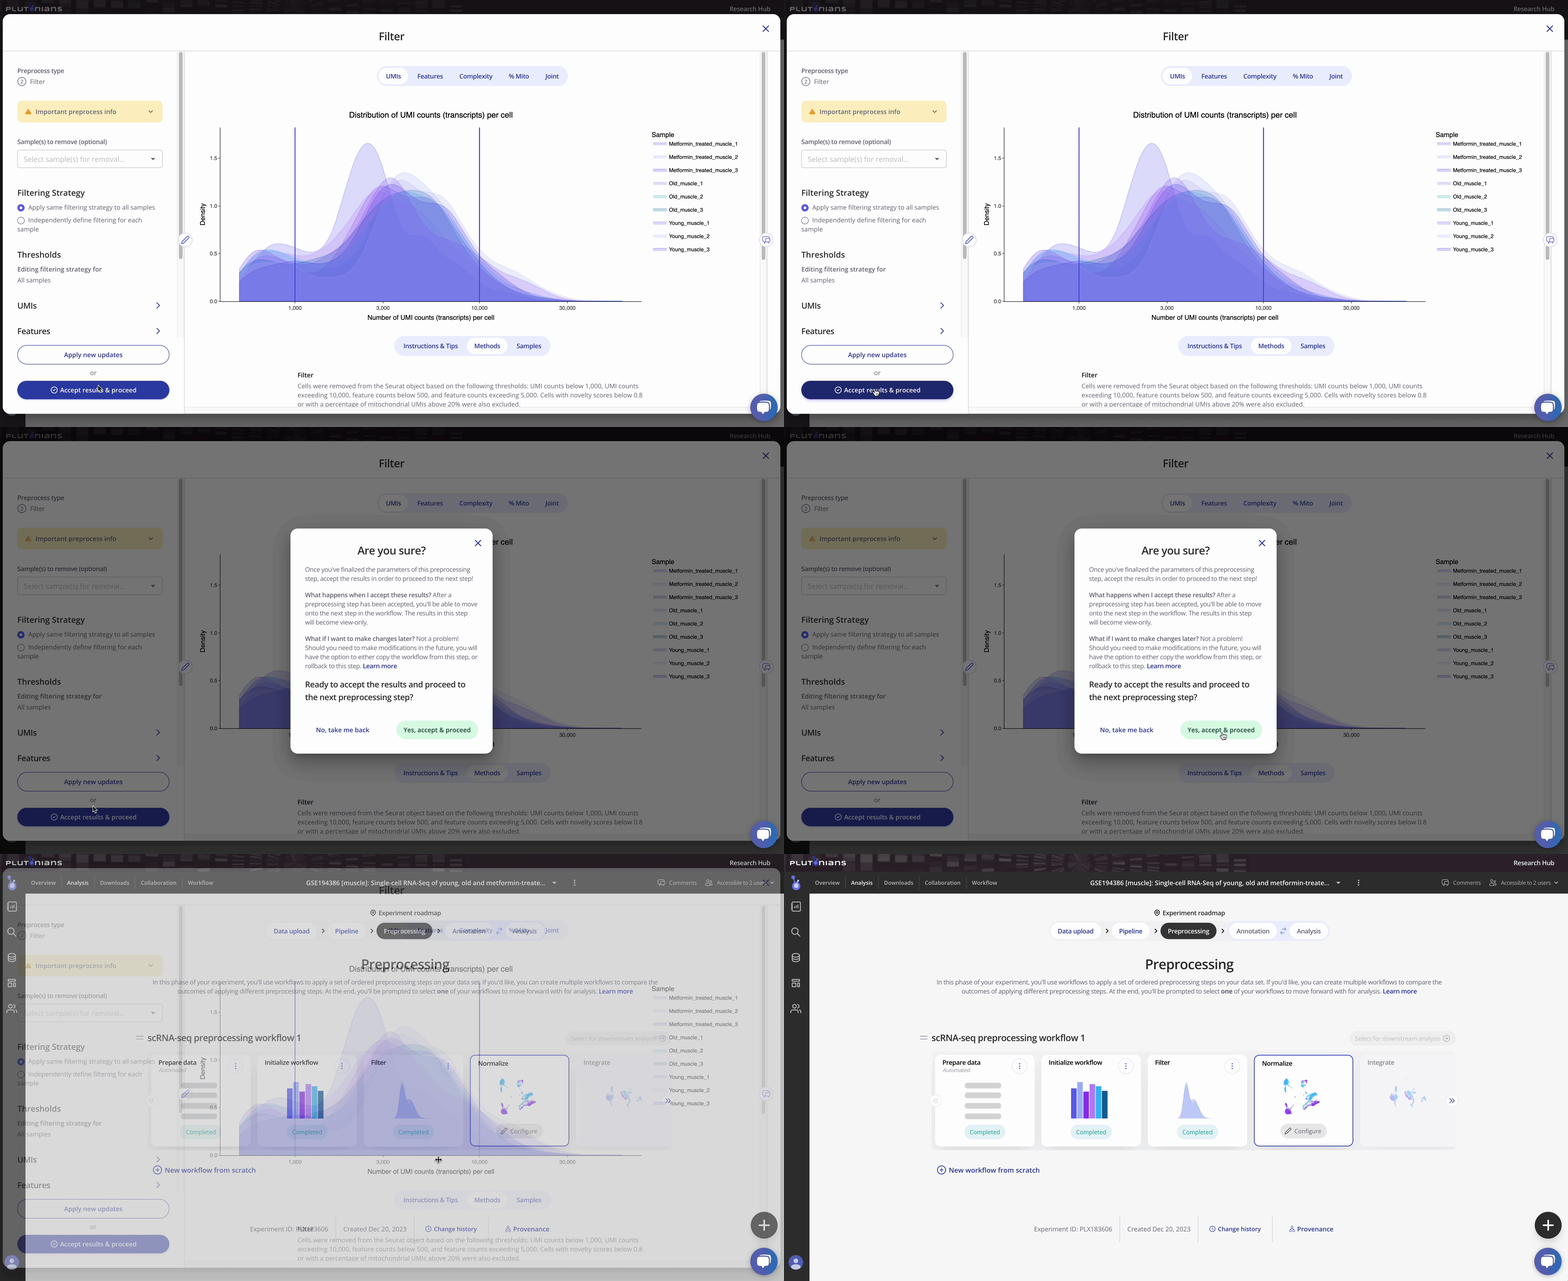
If you need to or want to change any of the preprocess parameters, you can rerun the process by updating your parameters and clicking the Apply new updates button. Once you are ready to move on to the next preprocessing step in the workflow, click Accept results & proceed. This will pop-up an additional confirmation window, where you can click Yes, accept & proceed to continue on with the workflow or No, take me back if you would like to keep modifying the Filter step.
What's next?
After you have successfully completed the Filter step, you will move on to the Normalize preprocess where you will normalize your data to ensure that gene expression from individual cells is comparable and that potential technical biases are minimized.
