Version updates to Pluto's out-of-the-box analyses
Overview
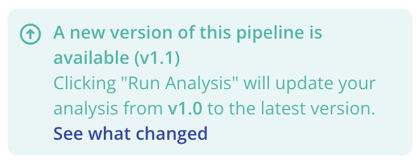
When a new version of an analysis is available, you'll see a green banner on the Analysis tab of your existing analyses notifying you that a new version is available.

After reviewing the changes made in the latest version, click the "Run analysis" button if you want to update your analysis version.
Change log
Note: The change log below does not include proprietary or customer-specific analyses. If your organization has configured its own analyses, your Pluto customer rep will communicate with you directly via email about any changes, per the terms in your signed service agreement.
Principal components analysis
v1.1 (2022-07-18)
Added the principal components summary measures table, which reports the proportion of variance explained by each principal component, as well as other measures. No changes were made to the calculation of PCA plot data.

v1.0
Principal components analysis (PCA) was implemented using the prcomp function in base R (v4.1). Users can toggle the Boolean values for scale and center. If selected by the user, CPM normalization is performed prior to running PCA using the cpm function in the edgeR R package (v3.36.0).
Gene set enrichment analysis
v1.2 (2022-12-30)
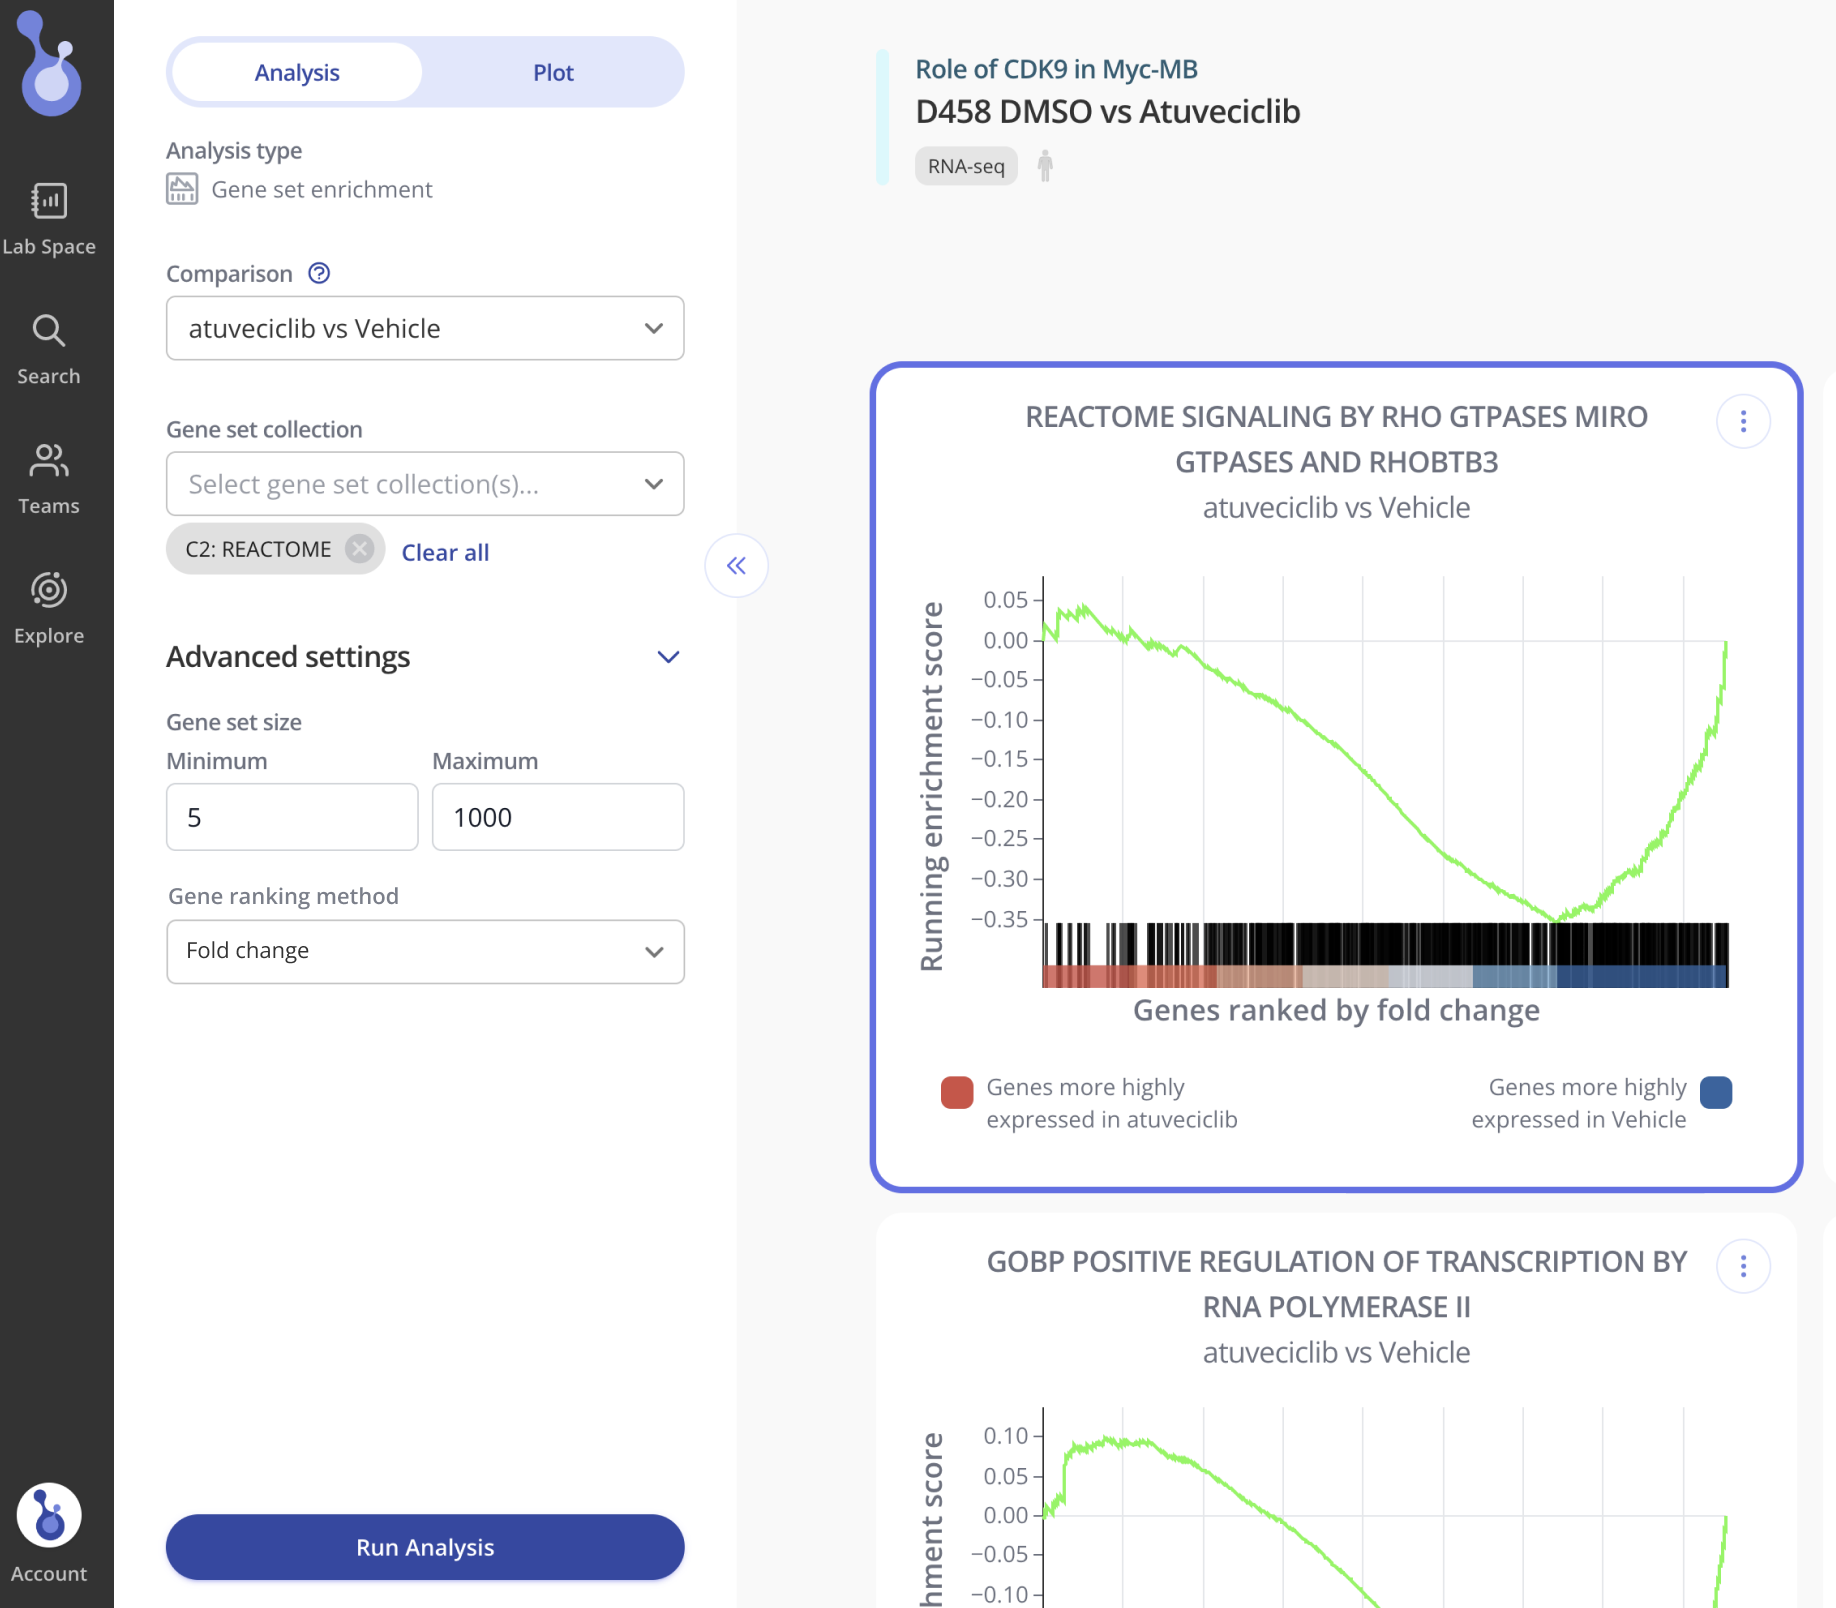
Added the ability to select from multiple different methods for ranking genes. The default (and method used for all prior runs) is "fold change." The newly added options allow filtering by p-value (non-directional), signed p-value, and fold change * p-value.

v1.1 (2022-07-18)
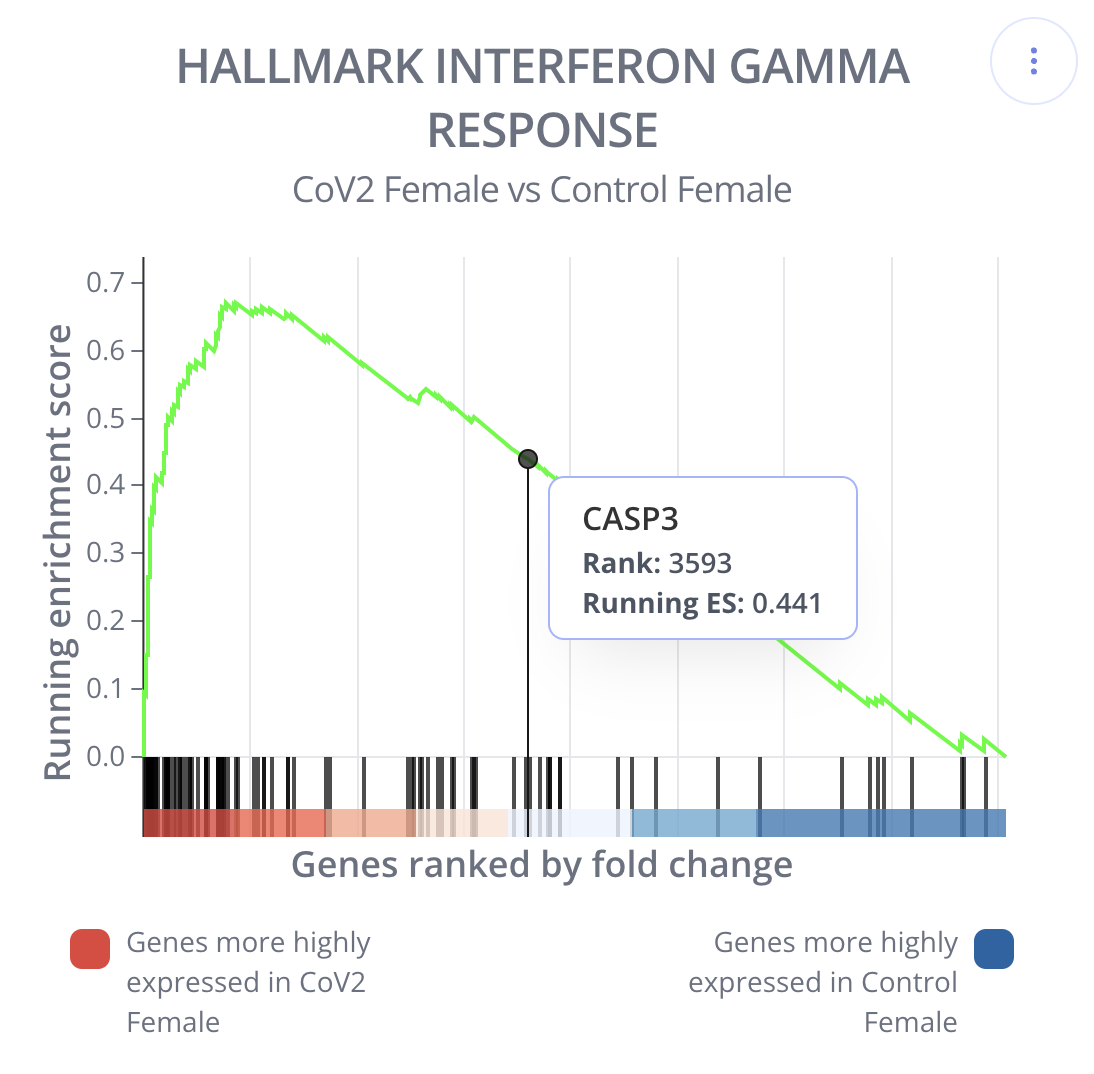
Added the Gene column to the enrichment plot data table. No changes were made to the calculation of the enrichment plot x and y values so the plots are unaffected besides the addition of the gene name in the hover text.

v1.0
Gene set enrichment analysis (GSEA) was implemented using the fgseaMultilevel function in the fgsea package (v). GSEA produces data for the enrichment plot as well as a gene sets summary table.
Differential expression analysis
v1.2 (2023-11-27)
Added the ability to optionally include covariates when running differential expression analysis with DESeq2. Learn more about using covariates.
v1.1 (2022-07-27)
Added heatmap plot option, which displays either the calculated z-score, average or mean counts per million (CPM) value of the experimental and control groups.
v1.0
Differential expression analysis was implemented using the DESeq function in the DESeq2 package (v1.24.0) with parameter pAdjustMethod = 'fdr'.
Image
v1.0
Image upload was implemented. No transformations to the actual image are run, the user can upload an image, write in the methods, and tag one or more targets that are present in the image.
Summary
v1.0
Summary analysis was implemented. No transformations to the data are run, the data is queried and displayed as-is in the user-uploaded assay data file.
Summary (CPM-normalized)
v1.0
Summary (CPM-normalized) analysis was implemented. The data in the user-uploaded assay data file is CPM-normalized using the cpm function in the edgeR R package (v3.36.0).
