Covariates such as batch or other factors can be "regressed out" in differential analyses
Overview
Finding genes that are differentially expressed between conditions is an integral part of understanding the molecular basis of phenotypic variation. Differentially expressed (DE) genes show differences in expression level between conditions or in other ways are associated with given predictors or responses.
Some experimental designs have confounding factors that, when adjusted for, produce more accurate results. Imagine an experiment where you want to compare treatment vs. control groups. However, if each of the replicates comes from a particular source, such as a different patient or cell line, the baseline differences in expression can be so great that it limits the differences you would see when comparing treatment vs. control. You can include the source within the differential expression model as a covariate in order to adjust for those differences, thus providing more confidence in the comparison results.
Some of the common confounding variables include: batch, cell line, tissue, patient_id.
Example: confounding variables in studies using patient samples
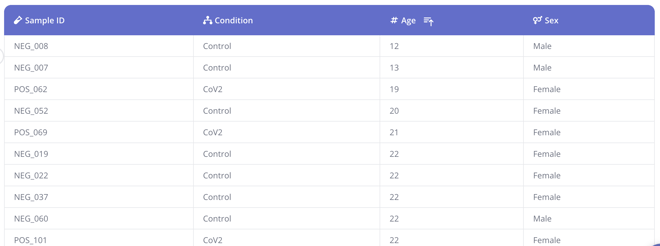
In the study we'll be using here to illustrate, we have patients of different ages and sexes, so we've included columns for each of those biological factors in the sample data table in Pluto. When we're asking a scientific question like "How does gene expression change in patients with CoV2 infection compared to healthy uninfected controls," it's important to be aware that biological factors such as patient age or sex could impact their gene expression, and thus may be reflected in your differential analysis results if not accounted for.

Covariates in differential analyses in Pluto
To try including one or more covariates when running a differential analysis in Pluto:
0. Make sure to include any potential confounding variables in your sample data table in Pluto.
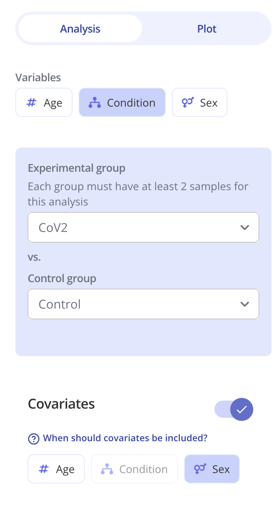
1. First select one or more "Variables" to group your samples by, and define an experimental and control group like you normally would. These groups should correspond to the scientific hypothesis you are testing. In the below example, we'll be testing for gene expression differences with CoV2 infection compared to Control (no infection).

2. Toggle on the "Covariates" option and select one or more covariates. These represent potentially confounding factors in your experiment. In this example, we are including sex as a potentially confounding factor because there are likely sex-related differences in gene expression that we want to adjust for in order to investigate the specific scientific question of interest here, which is infection vs control.
