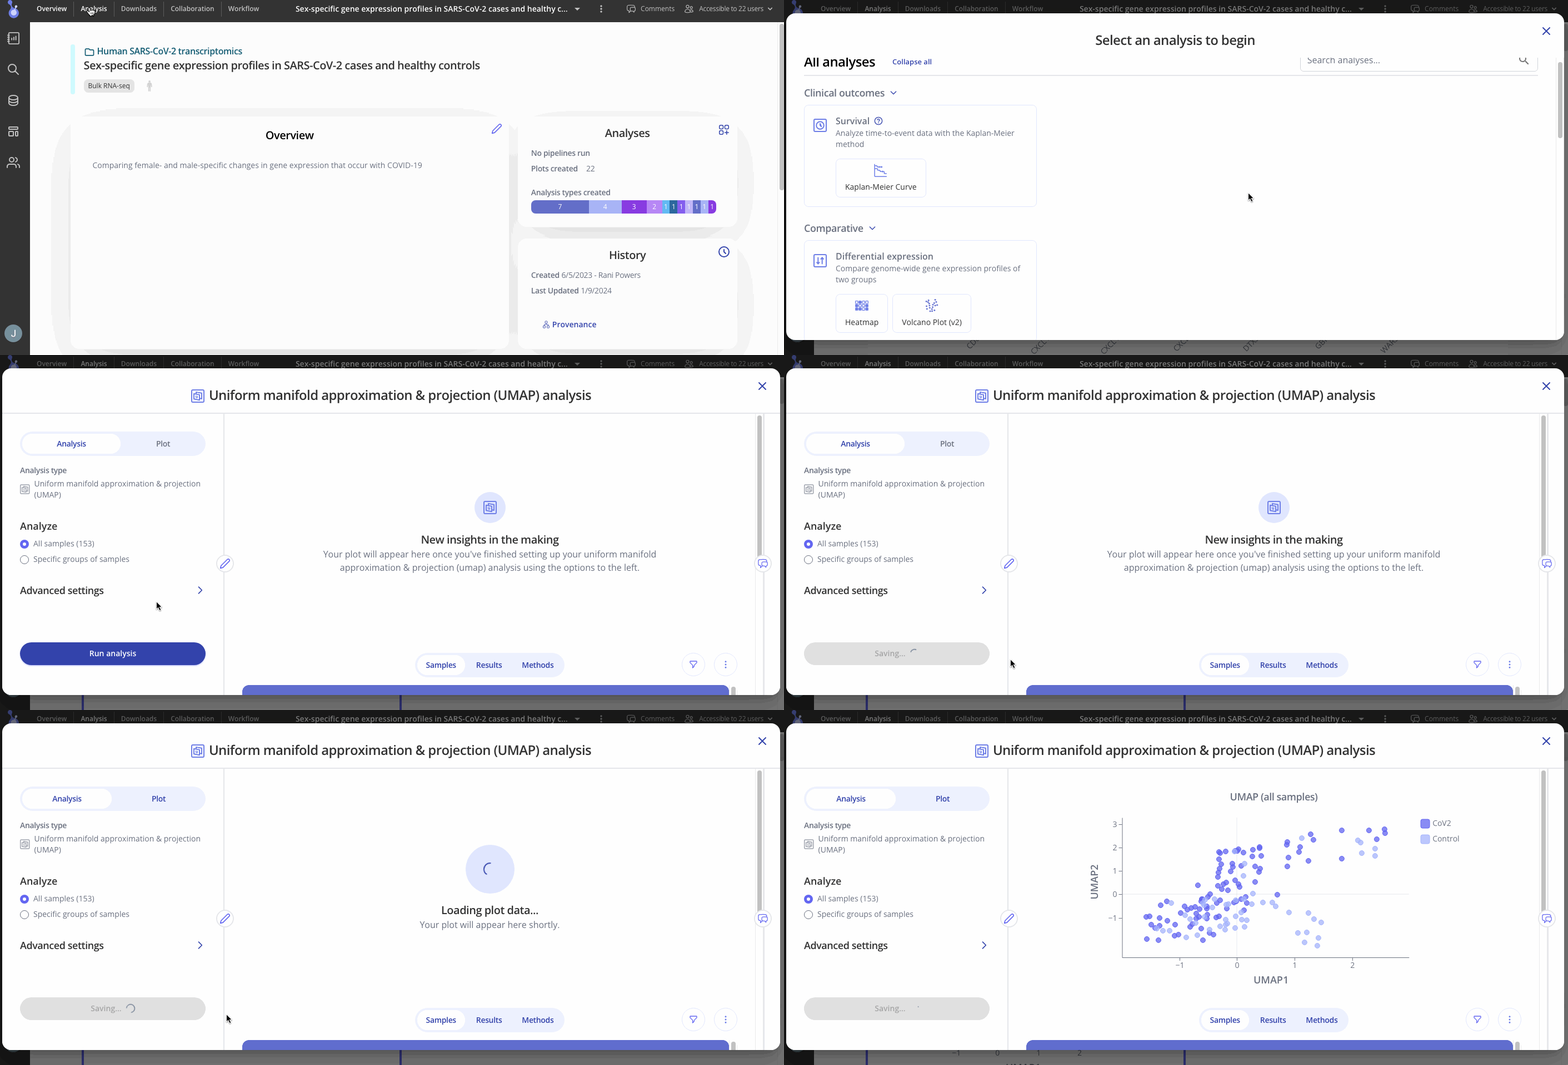
Running UMAP analysis on Pluto to explore your data!
Uniform Manifold Approximation and Projection (UMAP) is another common non-linear dimensionality reduction method that is similar to t-SNE but preserves the local and global structure of the data. This allows for resolving more subtle differences between clustered groups and is more reproducible.
Set Up Your Analysis
Navigate to your experiment and head to your analysis tab to set up your UMAP plot

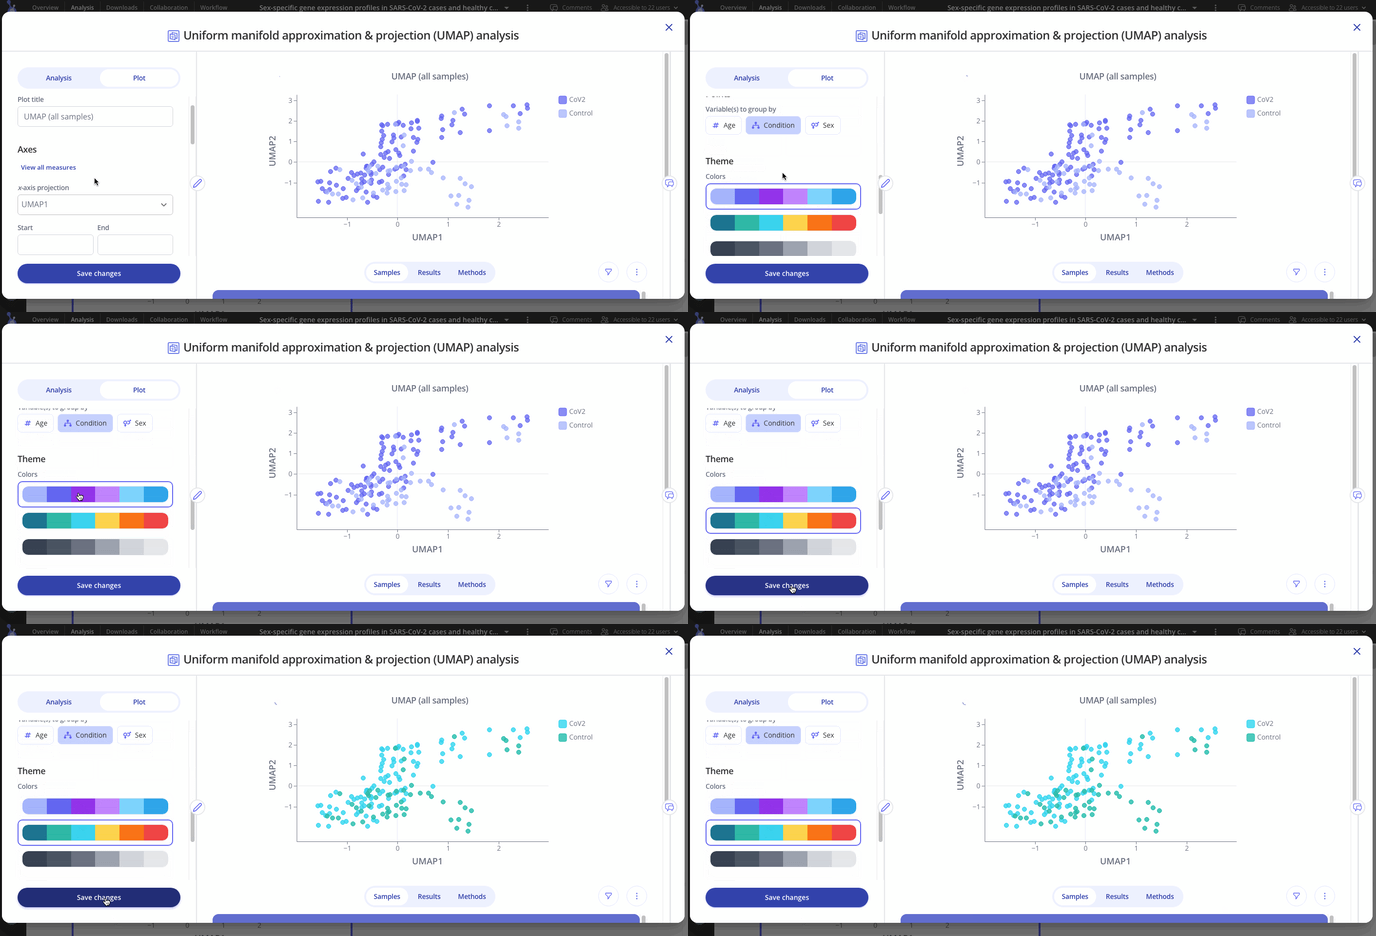
After you've made your initial plot, you can also customize its appearance by navigating to the plot tab. Here you can choose what variable you want to group your points by, change colors or modify the axes of your plot

UMAP on Pluto for single cell RNA-seq (scRNA-seq)
UMAP plots are generated for users when preprocessing scRNA-seq data from raw reads to a finished Seurat object for further analysis. During the pre-processing steps, UMAP plots are generated during the filtering, normalization, integration, and clustering steps of processing your Seurat object.
Use these plots to see how the data clusters and adjust parameters in the sidebar if needed to reduce variation in your processed Seurat object which will be used in downstream analysis.
Here are a list of options for each of these steps that users can choose to adjust after looking at UMAP plots:
Filtering: min/max numbers of UMIs per cell, features per cell and novelty score per cell.
Normalization: number of top variable features, principle components and neighboring points
Integration: number of principal components and nearest neighbors
Clustering: number of principal components, k for nearest neighbor algorithm and cluster resolutions.
