How to run t-SNE analysis on Pluto!
What is t-SNE?
t-distributed Stochastic Neighbor Embedding (t-SNE) is another common method for dimensionality reduction for visualizing data with multiple dimensions. The primary goal is to maintain pairwise similarities between data points so close neighbors remain nearby and distant points remain distant when reducing the data set down to two or three dimensions.
t-SNE visualization will produce distinct clusters and is particularly useful when you want to get an idea of how the data points are arranged when you have data points that relate to each other in a non-linear manner.
Making a t-SNE in Pluto
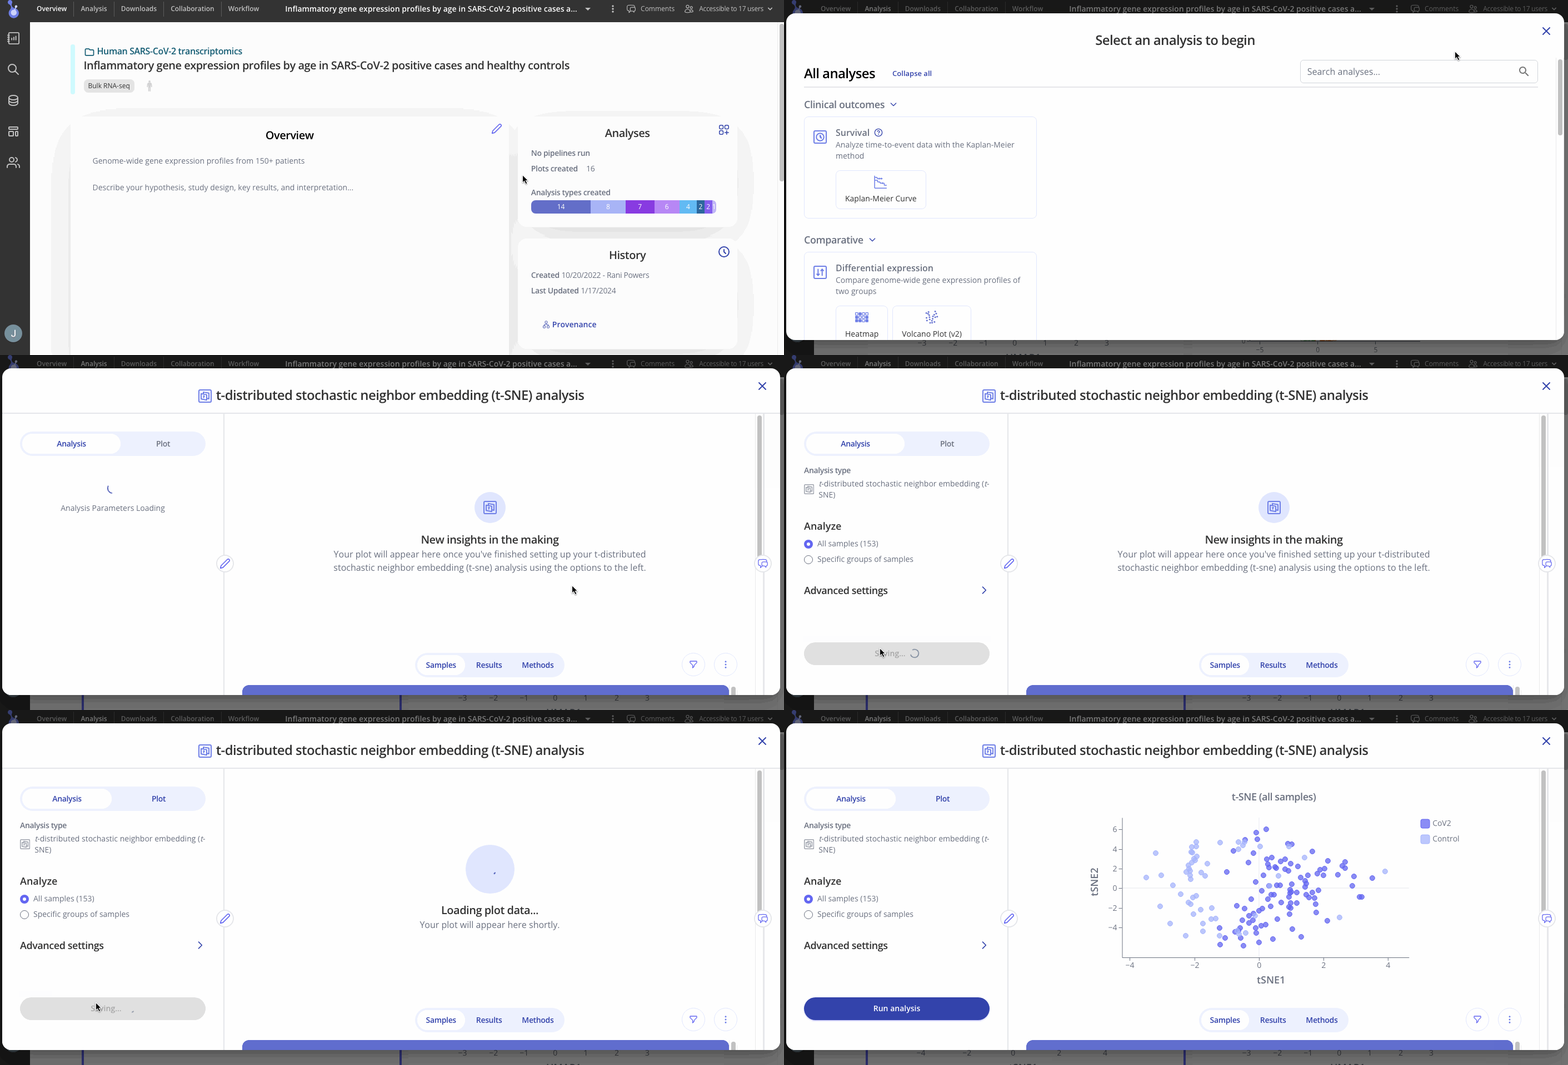
Navigate to your Experiment in your lab space and set up your analysis in the Analysis tab. To make your t-SNE, you can choose to include all samples or a specific group of samples.

Customize your t-SNE
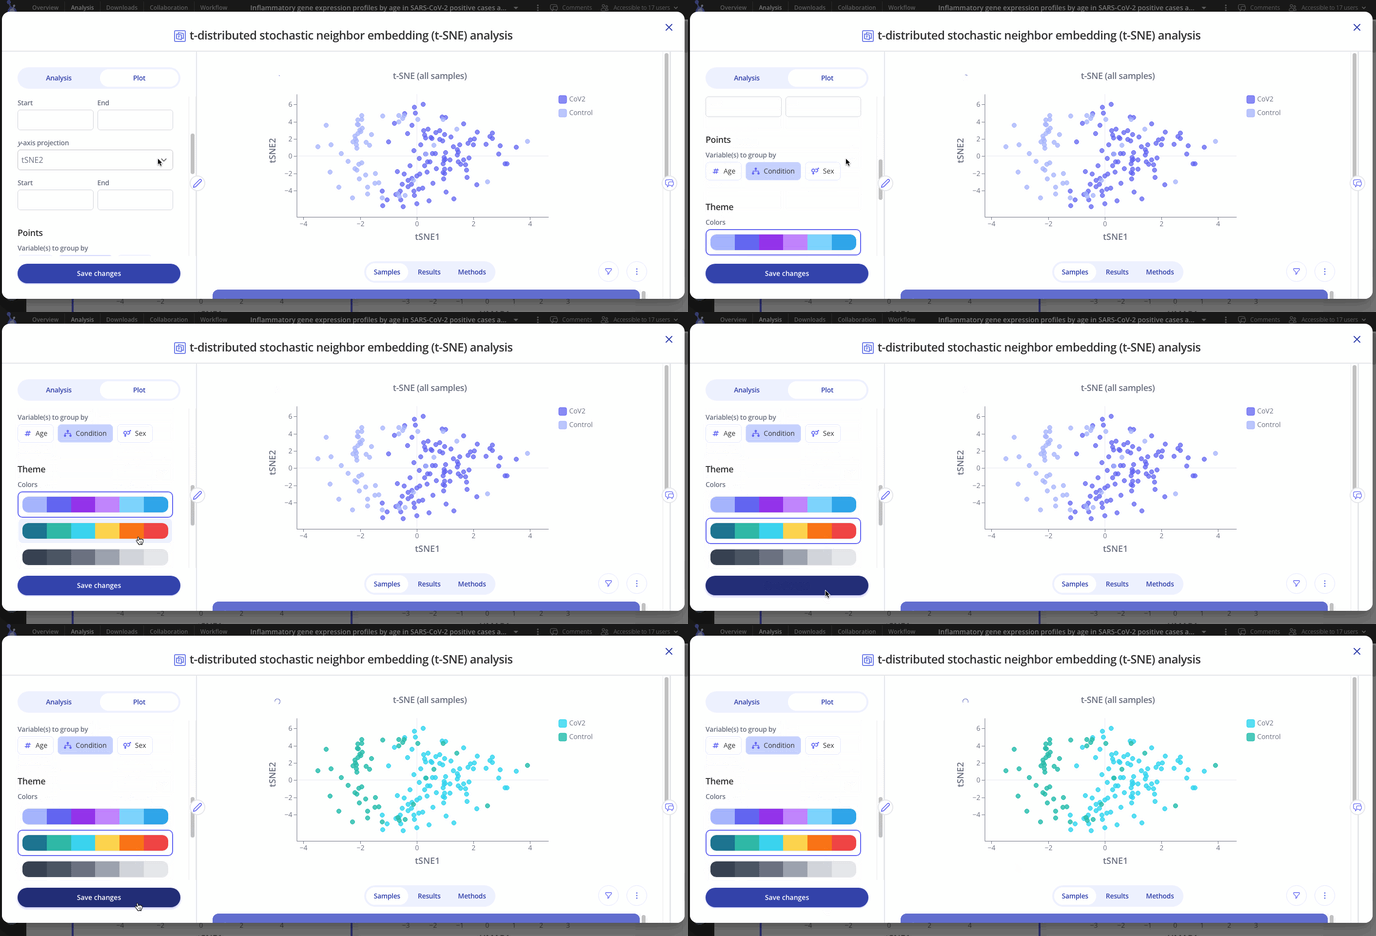
Navigate to the "Plot" tab in your analysis window to customize your plot. You can choose to group your samples by different variables, change the axes labels or range and change the colors on your plot.

