
Summarize results from multiple experiments in a project using this flexible canvas
Overview
A project in Pluto is a collection of multiple experiments addressing a common hypothesis or goal. The experiments in a project often have different types (e.g. RNA-seq, CUT&RUN, qPCR, etc), as shown in the screenshot below. You can find this section by navigating to the bottom of your lab space.
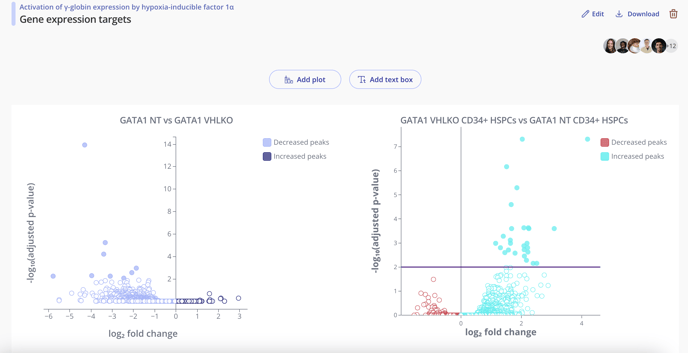
Storyboards are flexible canvases for creating project summaries (i.e. multi-panel figures) by combining plots and other results from multiple experiments in your project.

Creating a storyboard
Navigate to the project you'd like to summarize, and click the Storyboard tab in the top center. Click the + Storyboard button and give your storyboard an informative name.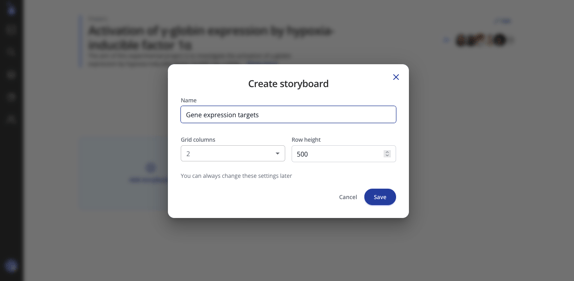
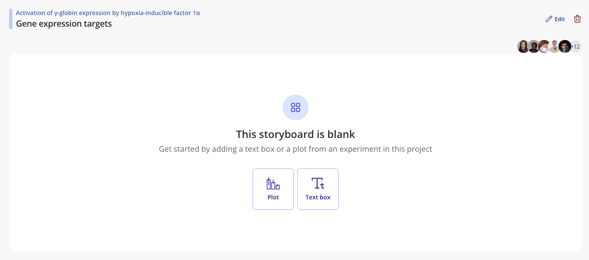
Then, select "Plots" to add specific plots from your experiments within this project or "Text Box" to add methods, analysis insights or any details you would like to share with collaborators.
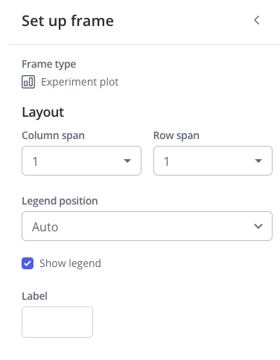
 You will then be prompted to set how much space you'd like each text or plot element to take up on the canvas. You can also specify where you'd like to have your legend placed on the plot and if you'd like to label your plot with a letter (ie: A for panel A in a figure)
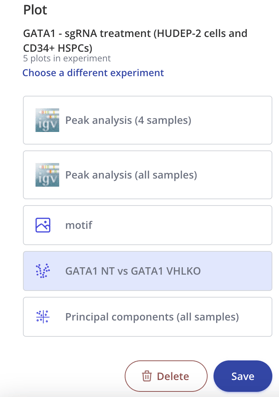
Plots can then be chosen from experiments within the project. Press save to add the plot to your storyboard.
Note: anyone with view or edit access on the project will be able to view all storyboards inside that project.