Access the methods used in generating your plots
All of the statistics and parameters used in making the plots for your experiment can be found on your experiment page, with a different methods section available for each plot you create. This is helpful for keeping notes on what data appears and the specifics of the statistics used to generate the plot.
Click the three dots on the right side of the plot to bring up the plot options and select "View methods"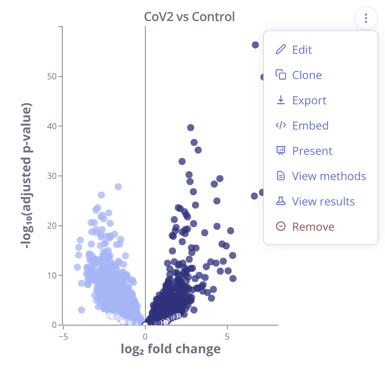
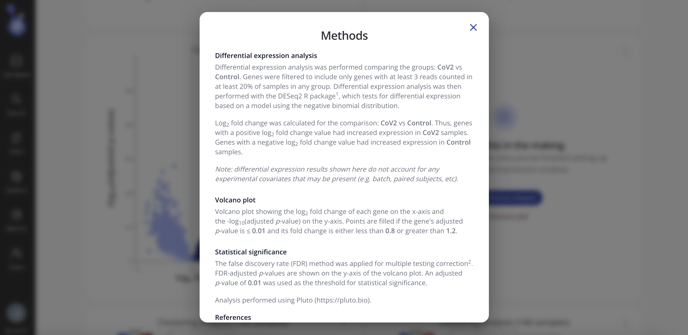
This will bring up a pop up with the methods used to create your plot including any statistical analysis packages used and statistical parameters or filters applied to your data. You will also see the comparisons made within your plot as well as any notes. References for the packages used to generate your plot will be at the bottom of this pop up window along with your experiment, plot and analysis IDs.