
Use a heatmap to visualize gene expression data across different samples
The clustering analysis type is useful for identifying gene expression patterns between different samples or groups in your experiment. Within your heat map, each row corresponds to a gene and each column corresponds to a sample with the color at each intersection representing the expression level of that gene.
To run a clustering analysis in Pluto, click ![]() and scroll down to on the sidebar until you reach "Clustering (differential features)"
and scroll down to on the sidebar until you reach "Clustering (differential features)"
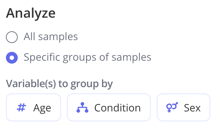
 Then choose what comparison you'd like to make between the groups within your experiment. You can also choose whether you'd like to analyze all your samples or specific groups of samples and make a selection.
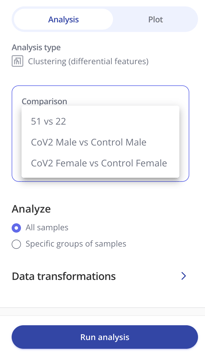
Then select Run analysis to generate your plot!
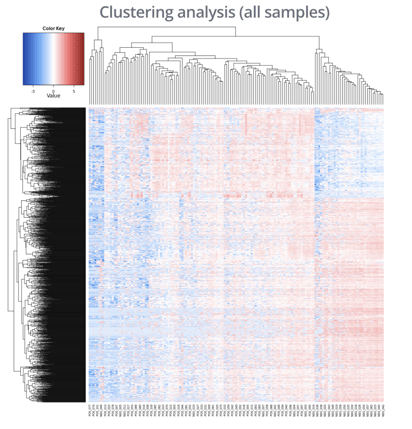
After the plot appears, you can go to the Plot tab in the same sidebar and make adjustments to your plot titles and the gradient color scheme used for the heatmap.
Use the Cluster samples checkbox to control whether samples (columns) are sorted according to hierarchical clustering computed similarity between their expression profiles.

Alternatively, unselecting the Cluster samples checkbox will remove the dendrogram from the top of the heatmap and samples will be sorted alphabetically instead of based on gene expression similarity.
