Running the ChIP-seq pipeline in Pluto!
Identify transcription factor binding sites to see how your DNA binding proteins are regulating gene expression with our ChIP-seq pipeline.
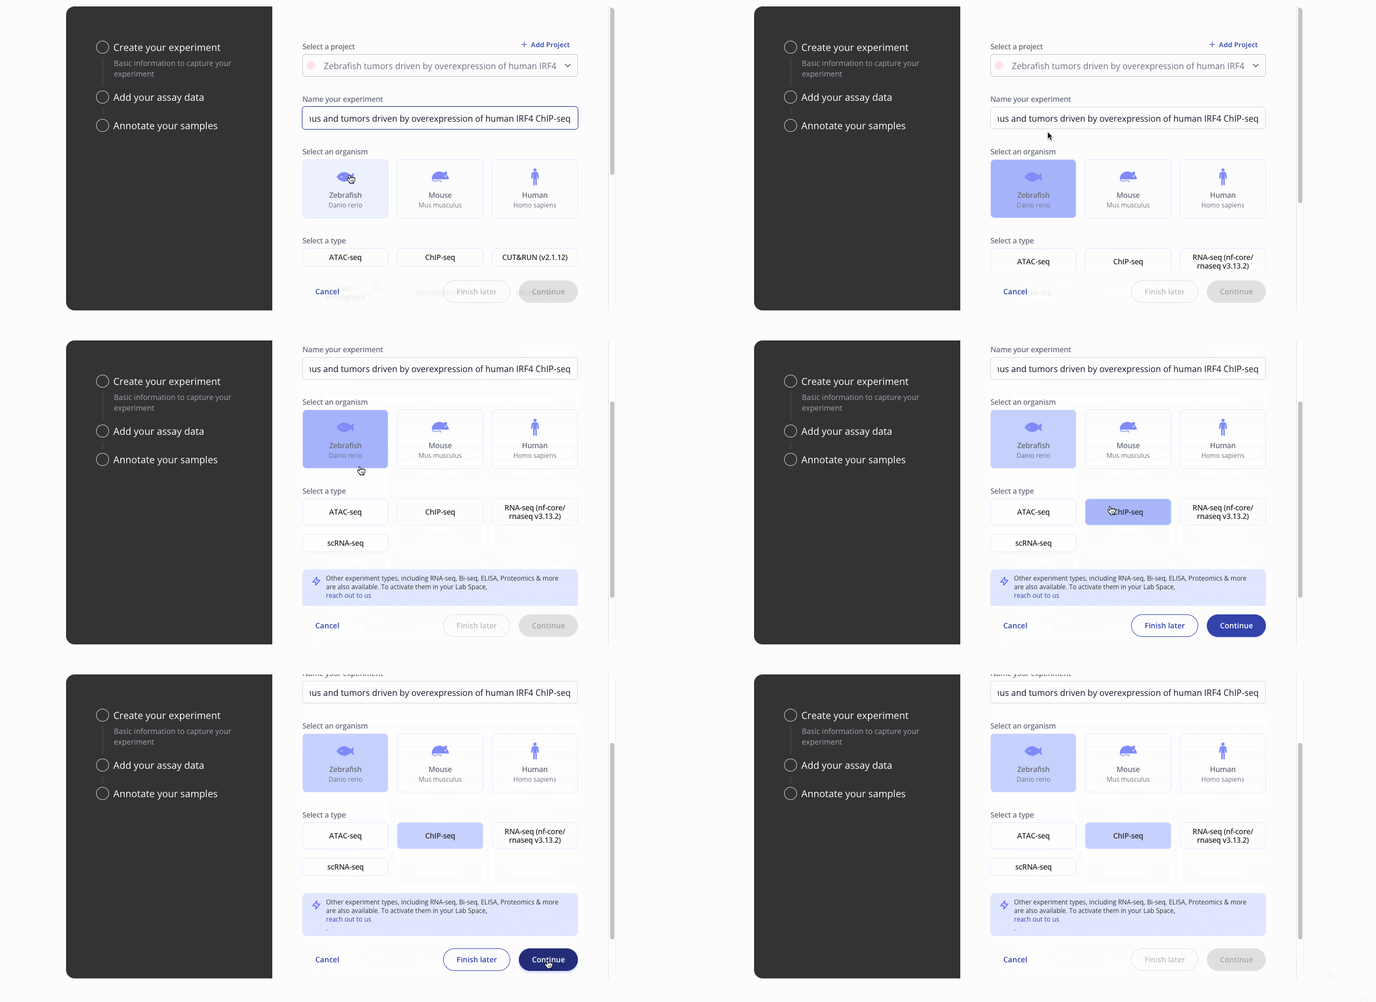
- Start by choosing with project to associate your experiment with, the model organism for your experiment and the experiment type.
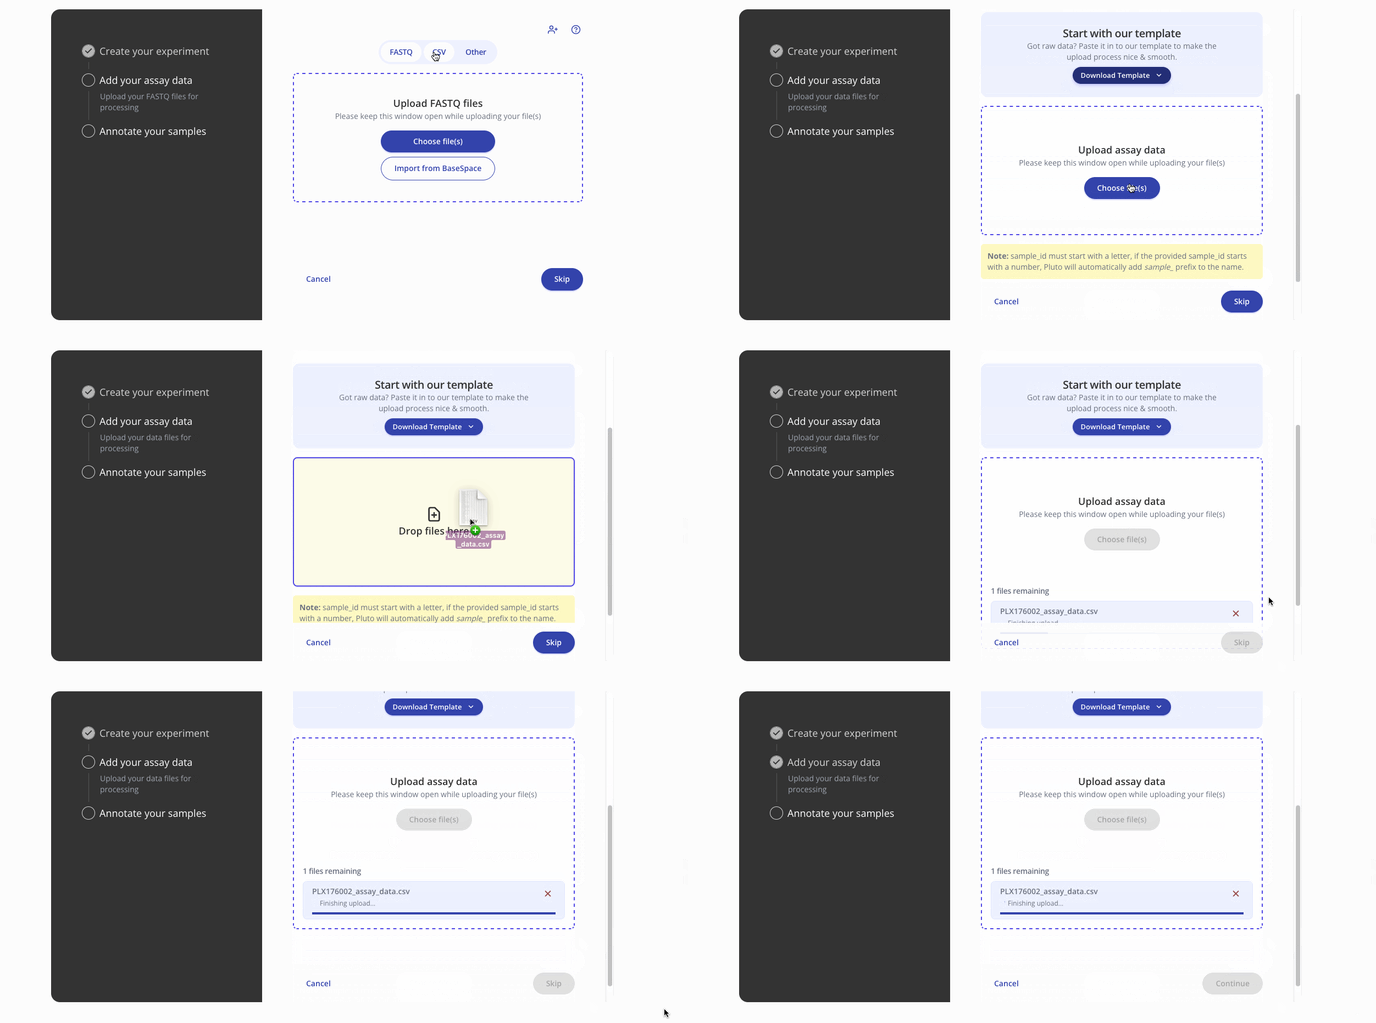
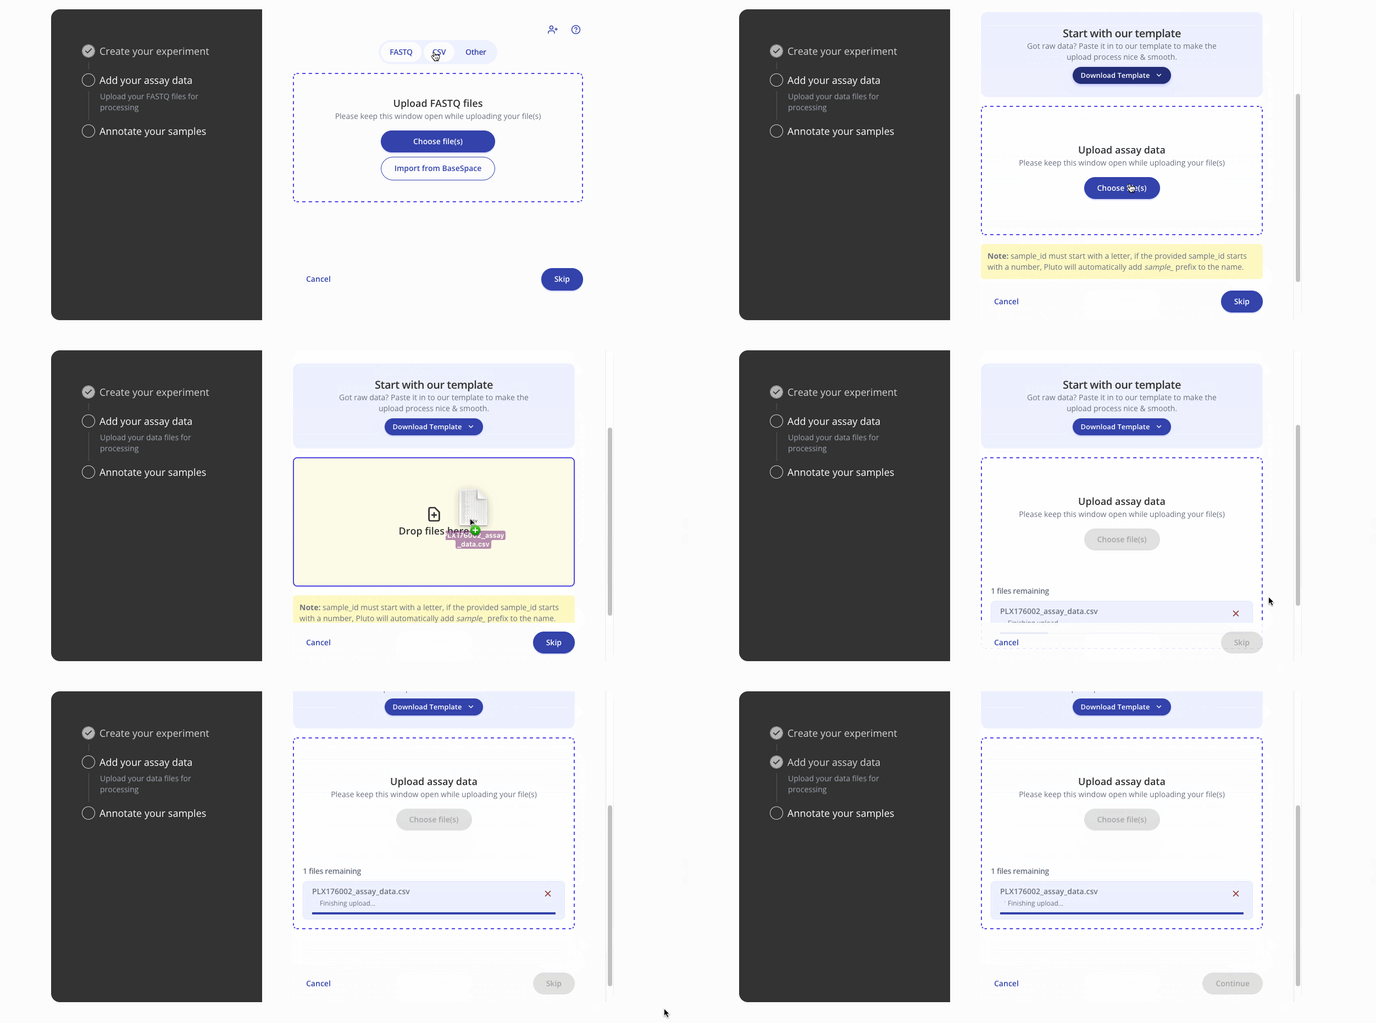
- Then you'll proceed to the step to add your assay data. You can upload raw data files such as a FASTQ or a processed .csv for assay data. Press continue to proceed to the sample data upload step.
- Next you'll upload sample data in a .csv format with annotations for each of the samples in your dataset. Below is a sample from a ChIP-seq dataset.

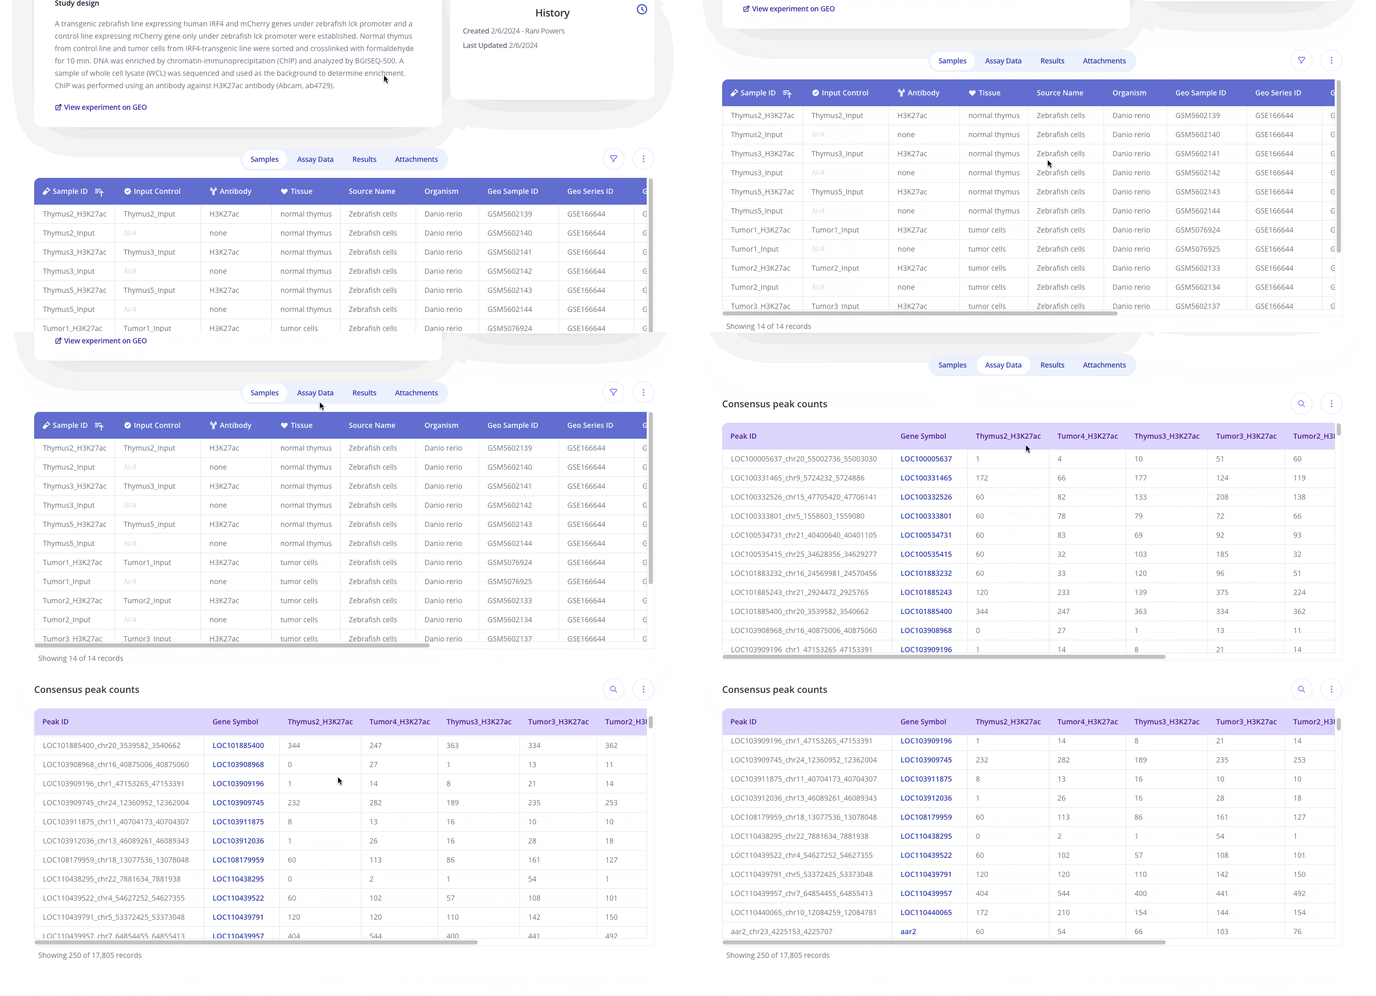
- From here you'll be taken to your Experiment Overview page where you can add an experiment overview such as comments on your experiment, track plots created and view sample data, assay data, results from your analyses and any attachments you've added to your experiment.
- From here, you can head to the analysis tab and use the +Analysis button to start creating plots.
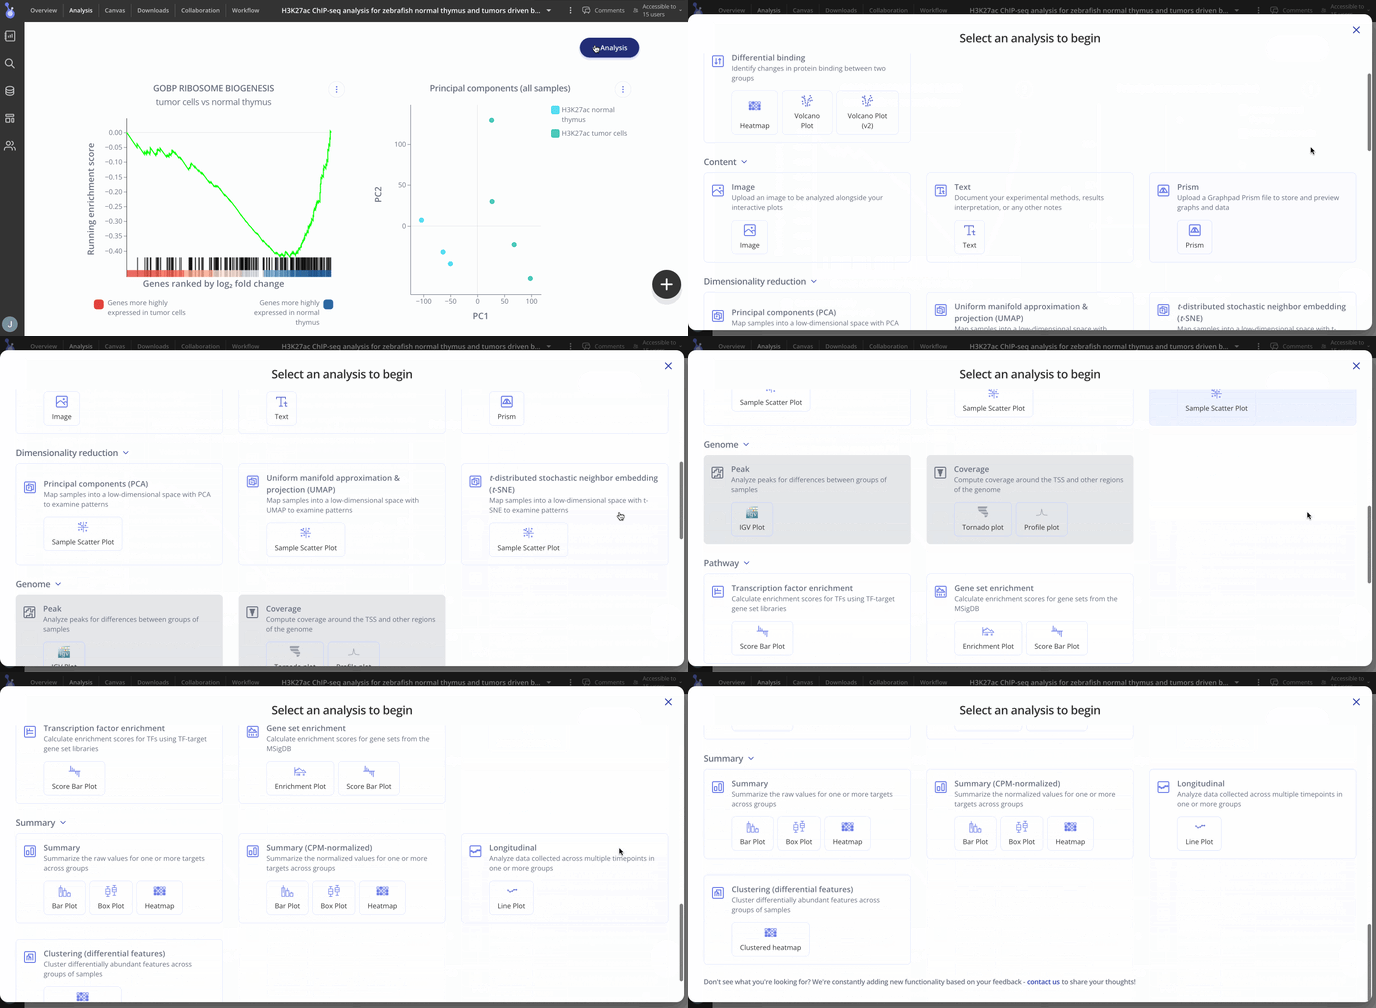 For ChIP-seq we have these plot types you may be interested in making for your data. With raw data files, you'll have access to all possible plot types with the experiment.
- Differential Binding (Heatmap, Volcano plots)
- Summary analysis (raw or CPM normalized counts)
- Gene Set Enrichment Analysis (score bar plot, enrichment plot
- Transcription Factor Enrichment (score bar plot)
