A new Pluto feature for aggregating your data within an experiment to share your results, methods and insights
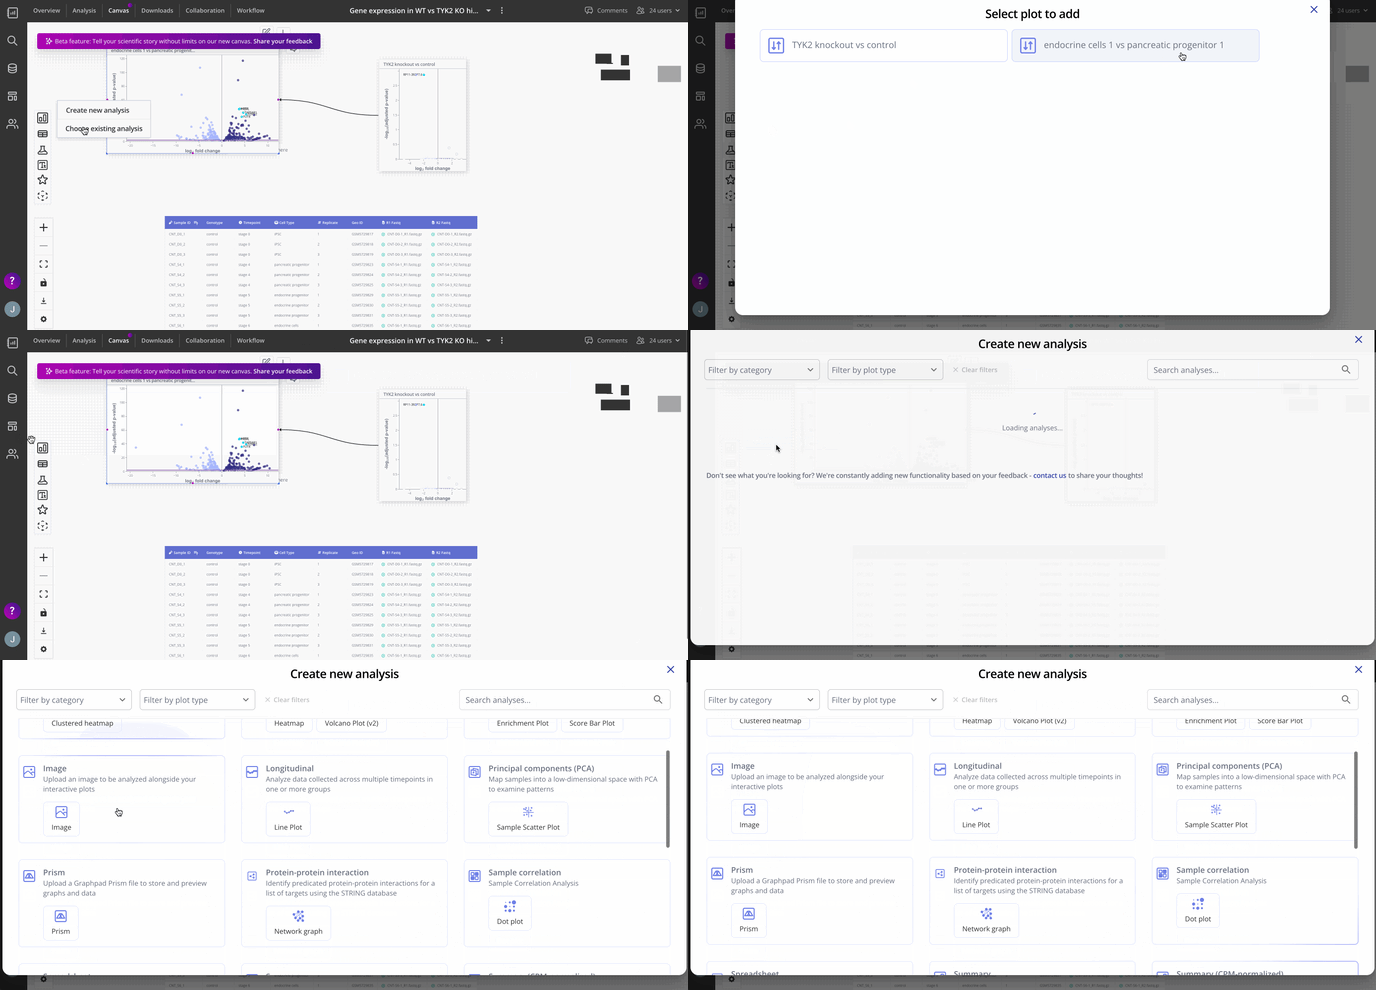
Within each experiment you create in your lab space is the Canvas tab, a new beta feature in Pluto! Here, you can add plots, data tables, methods and data insights all into one space to share with your lab or with collaborators.
On the sidebar you can see the variety of data you can add to your canvas, which is pulled from all the information you've added to the experiment you have open.

You can add...
- Plots - from a new or existing analysis

- Data and Results

- Text - generates a customizable text box, good for adding notes to your data about the plot, methods or anything else you may want to share.
- Shapes
