Longitudinal analysis
Last updated: June 4, 2025
Analyze data collected across repeated measures in one or more groups
Background
Longitudinal analysis is useful when analyzing repeated sets of measurements for one or more targets over a continuous variable such as time or dose. The goal of longitudinal analysis is often to understand how the average value within a group changes over time, and also to visualize the variability between replicates at the same and different time points.
Data formatting requirements
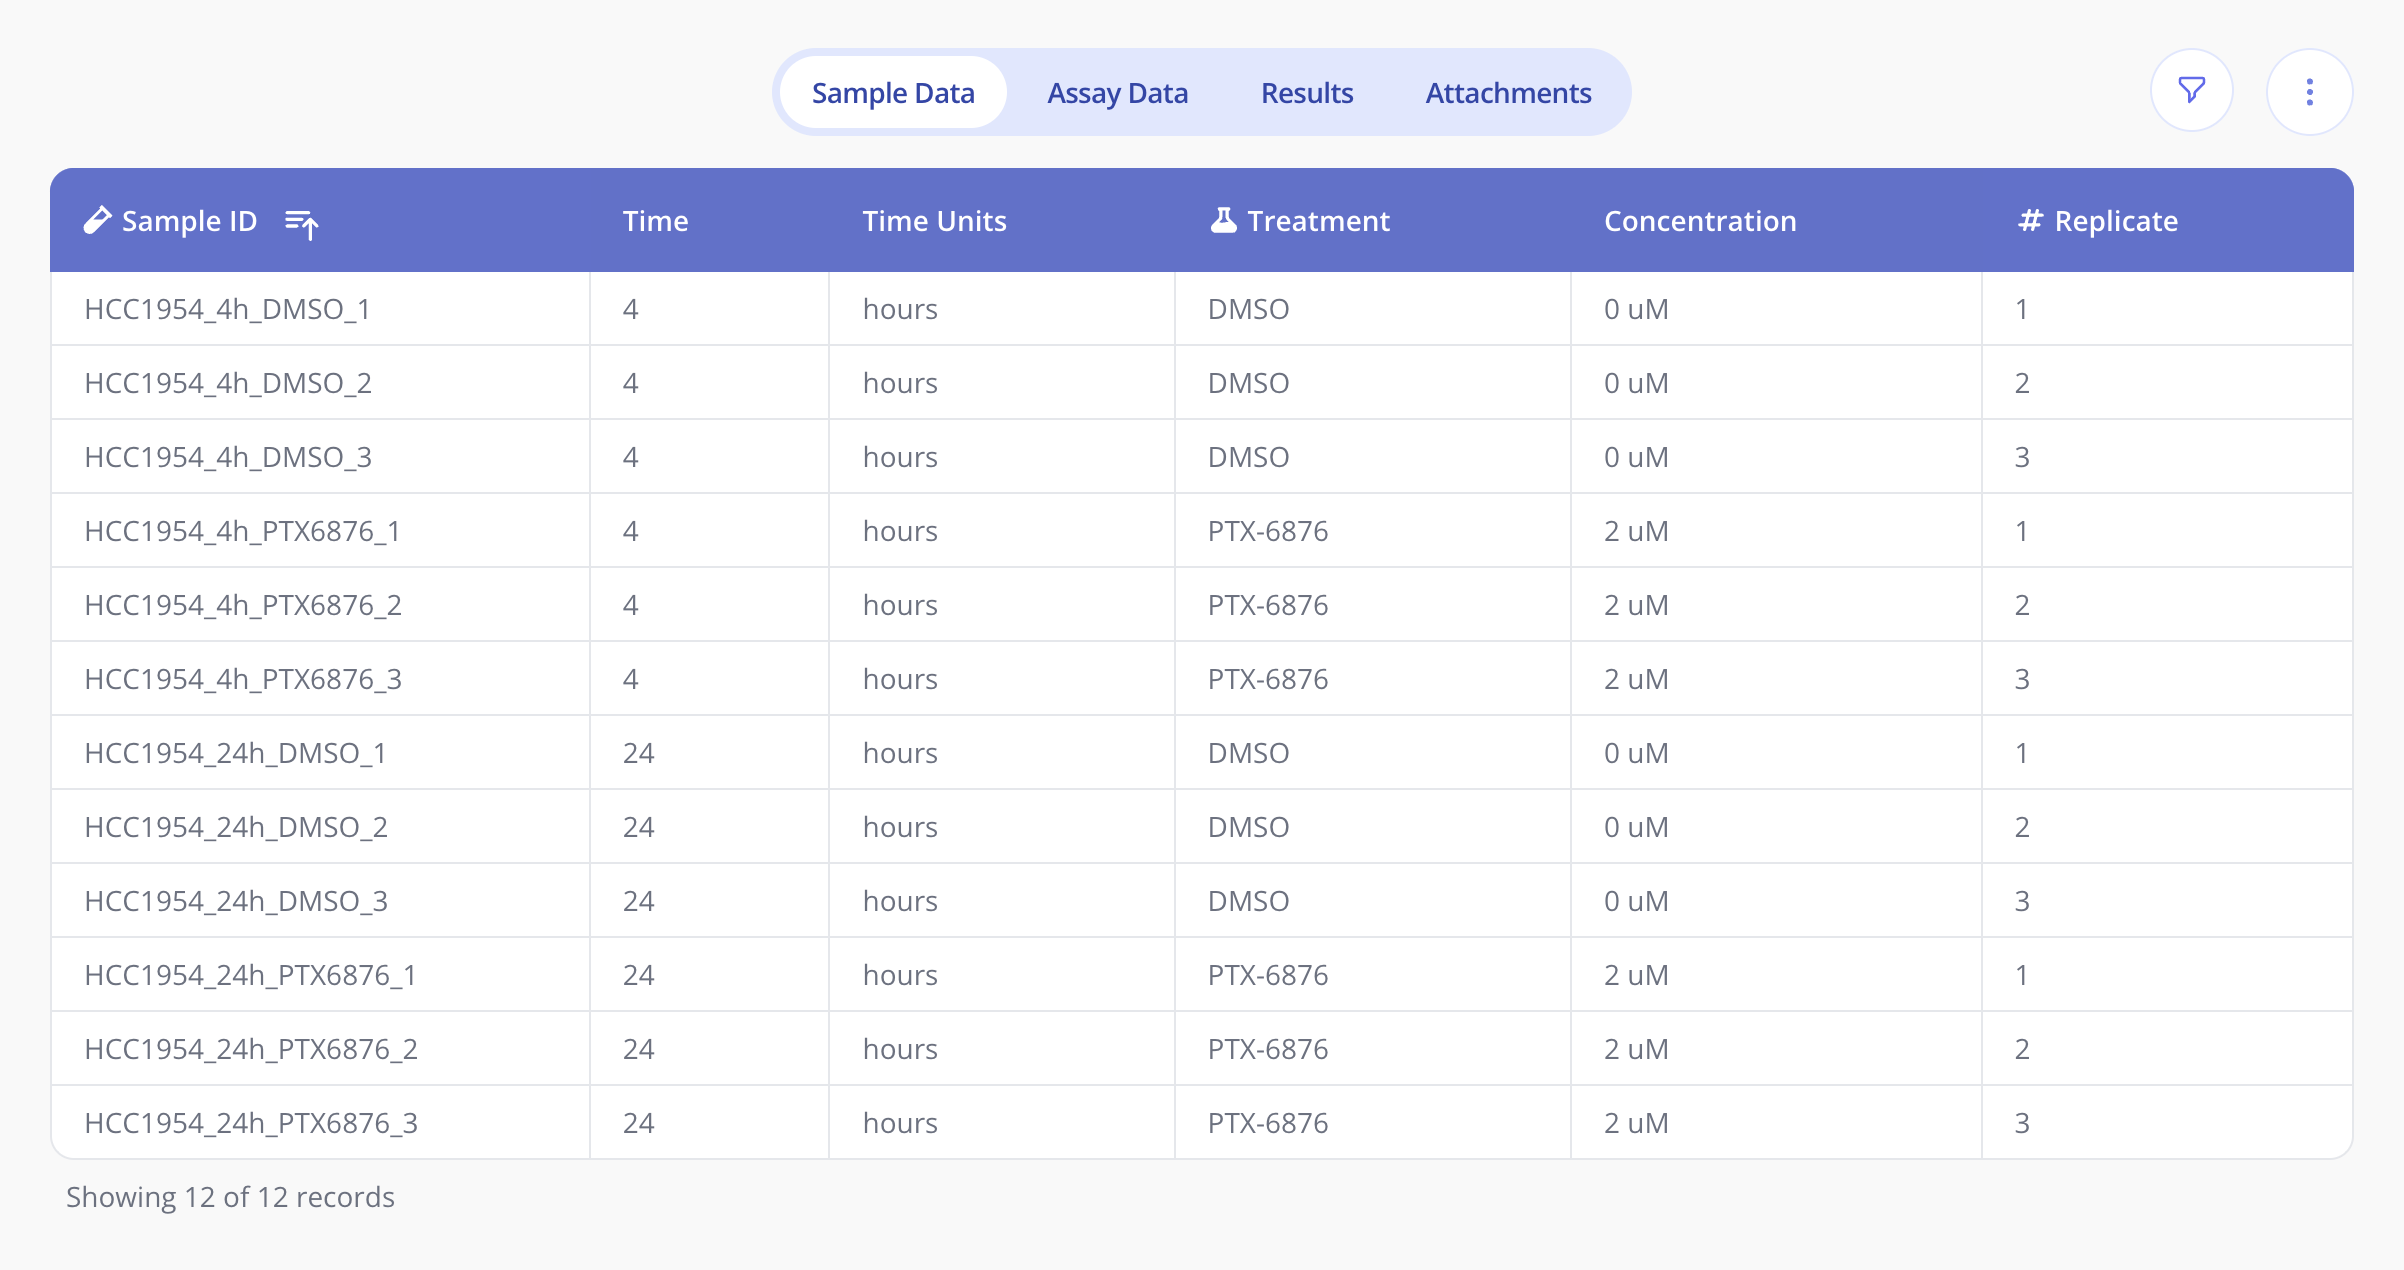
To run longitudinal analysis in Pluto, you'll need to include a numeric column in the sample data table that you upload to Pluto.
Give the column an informative name (e.g. Time, Dose, your "longitudinal variable")
All values in the longitudinal variable column must be numeric
All values in the longitudinal variable column should be in the same units (e.g. hours, days)
Optionally, to track the units for your longitudinal variable, you can include a Units column in the sample data table:
Running longitudinal analysis in Pluto
Create an experiment in Pluto and upload your sample data table containing a longitudinal variable columns. Upload the corresponding assay data for the experiment as normal.
Click "+ Analysis" and select the Longitudinal option, then click "Next" to set up your analysis. Select the appropriate longitudinal variable column from the first dropdown, and in the second drop-down, select one or more targets to include in your analysis (maximum 5).
To split your samples into multiple data series (i.e. lines), toggle on the "Split samples by groups" option and select on or more variables to group your samples by.
Click "Run Analysis" to see the results.
More examples of longitudinal analysis
In addition to plotting Time on the x-axis, longitudinal analysis can also be used to summarize a measured value by patient's Age:
Or by increasing Dose.