Customize the legend and colors on plots you create in Pluto
Overview
A critical part of making a plot "publication-ready" is getting the legends and colors just right! In Pluto, each plot can be edited with custom colors to perfectly match the other figures in your publication, presentation, or other work. You can also edit and order the display names within your legends as you see fit.
Using color themes
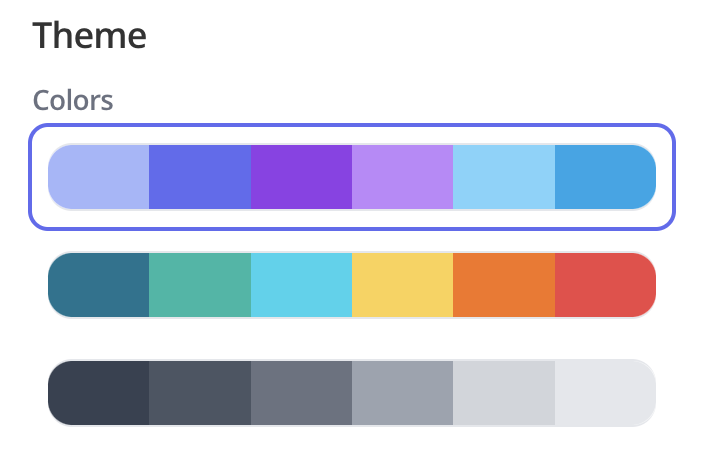
New plots use the Pluto "cool" theme by default, but you can select a warm or monochrome theme instead. Select the new theme and tap "View Changes" to see the updated theme applied to the plot.

Color by different variables
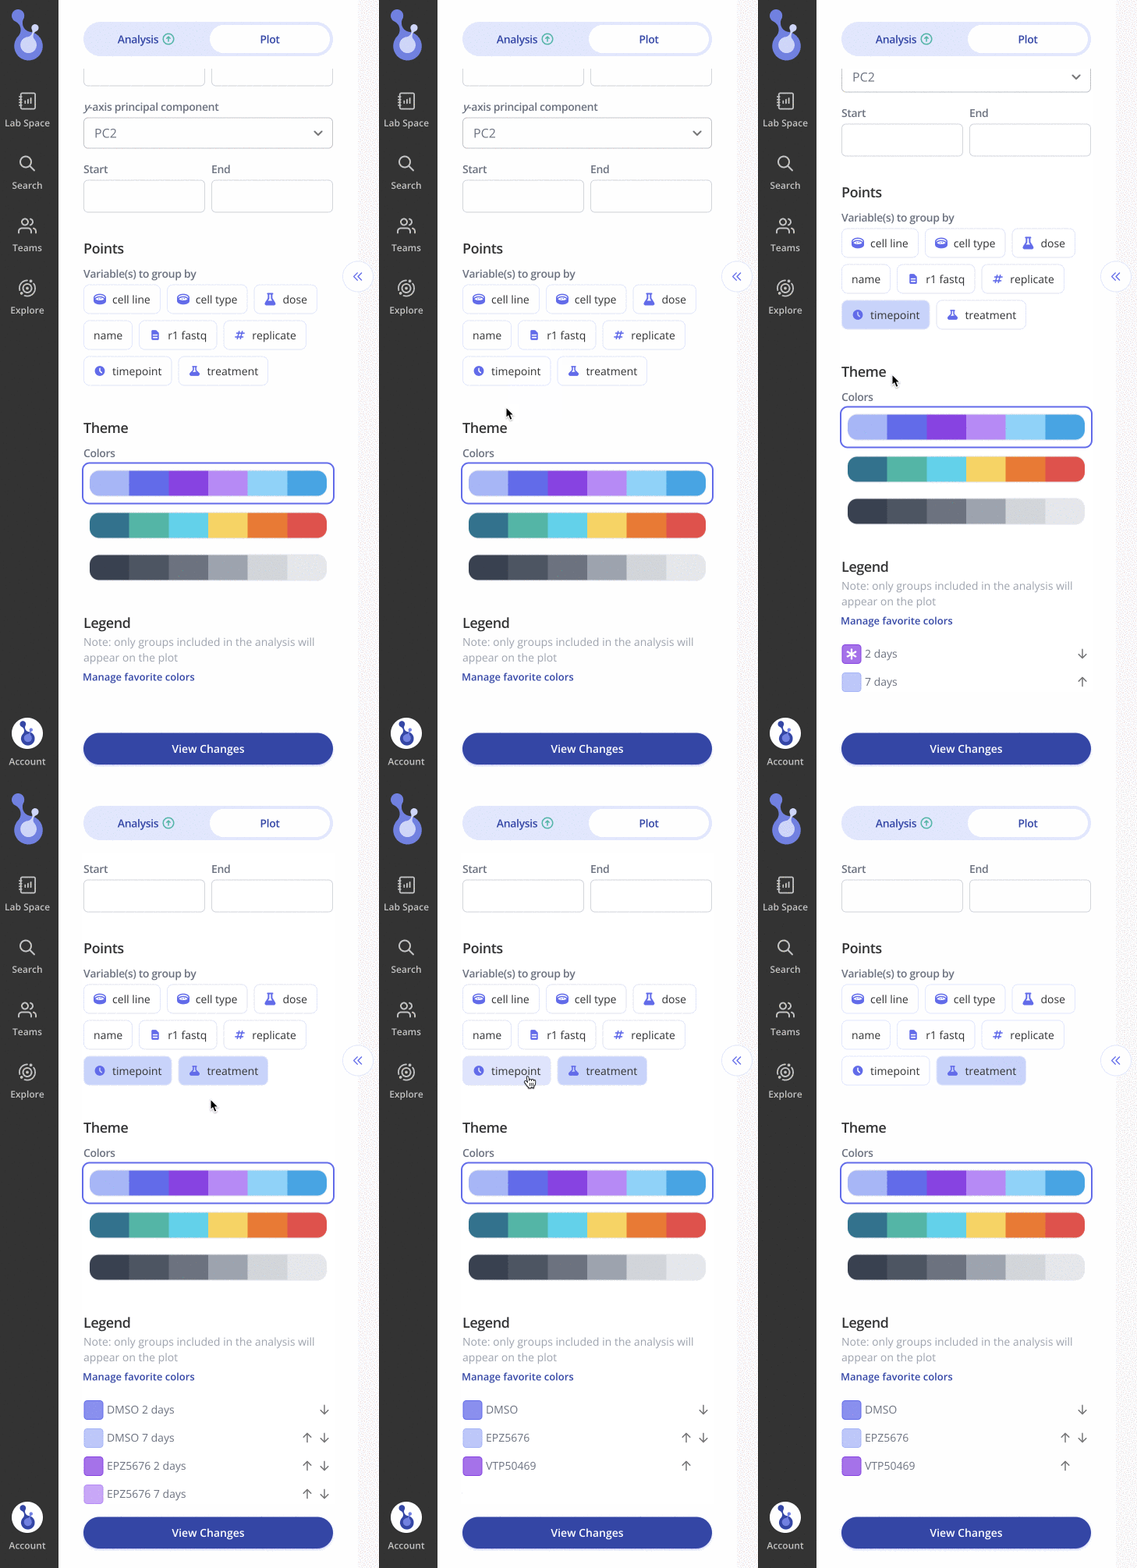
In Pluto, variables come from the columns of the sample data table you uploaded (e.g. condition, treatment). When customizing a plot, you can choose to color the plot by one or more variables.
Open the "Edit Plot" menu and select the one or multiple variables that you'd like to color by. Note that the groups in the Legend section change to reflect your selection.

Click "View Changes" to update the plot with your selected groups and colors.
Using custom colors on a plot
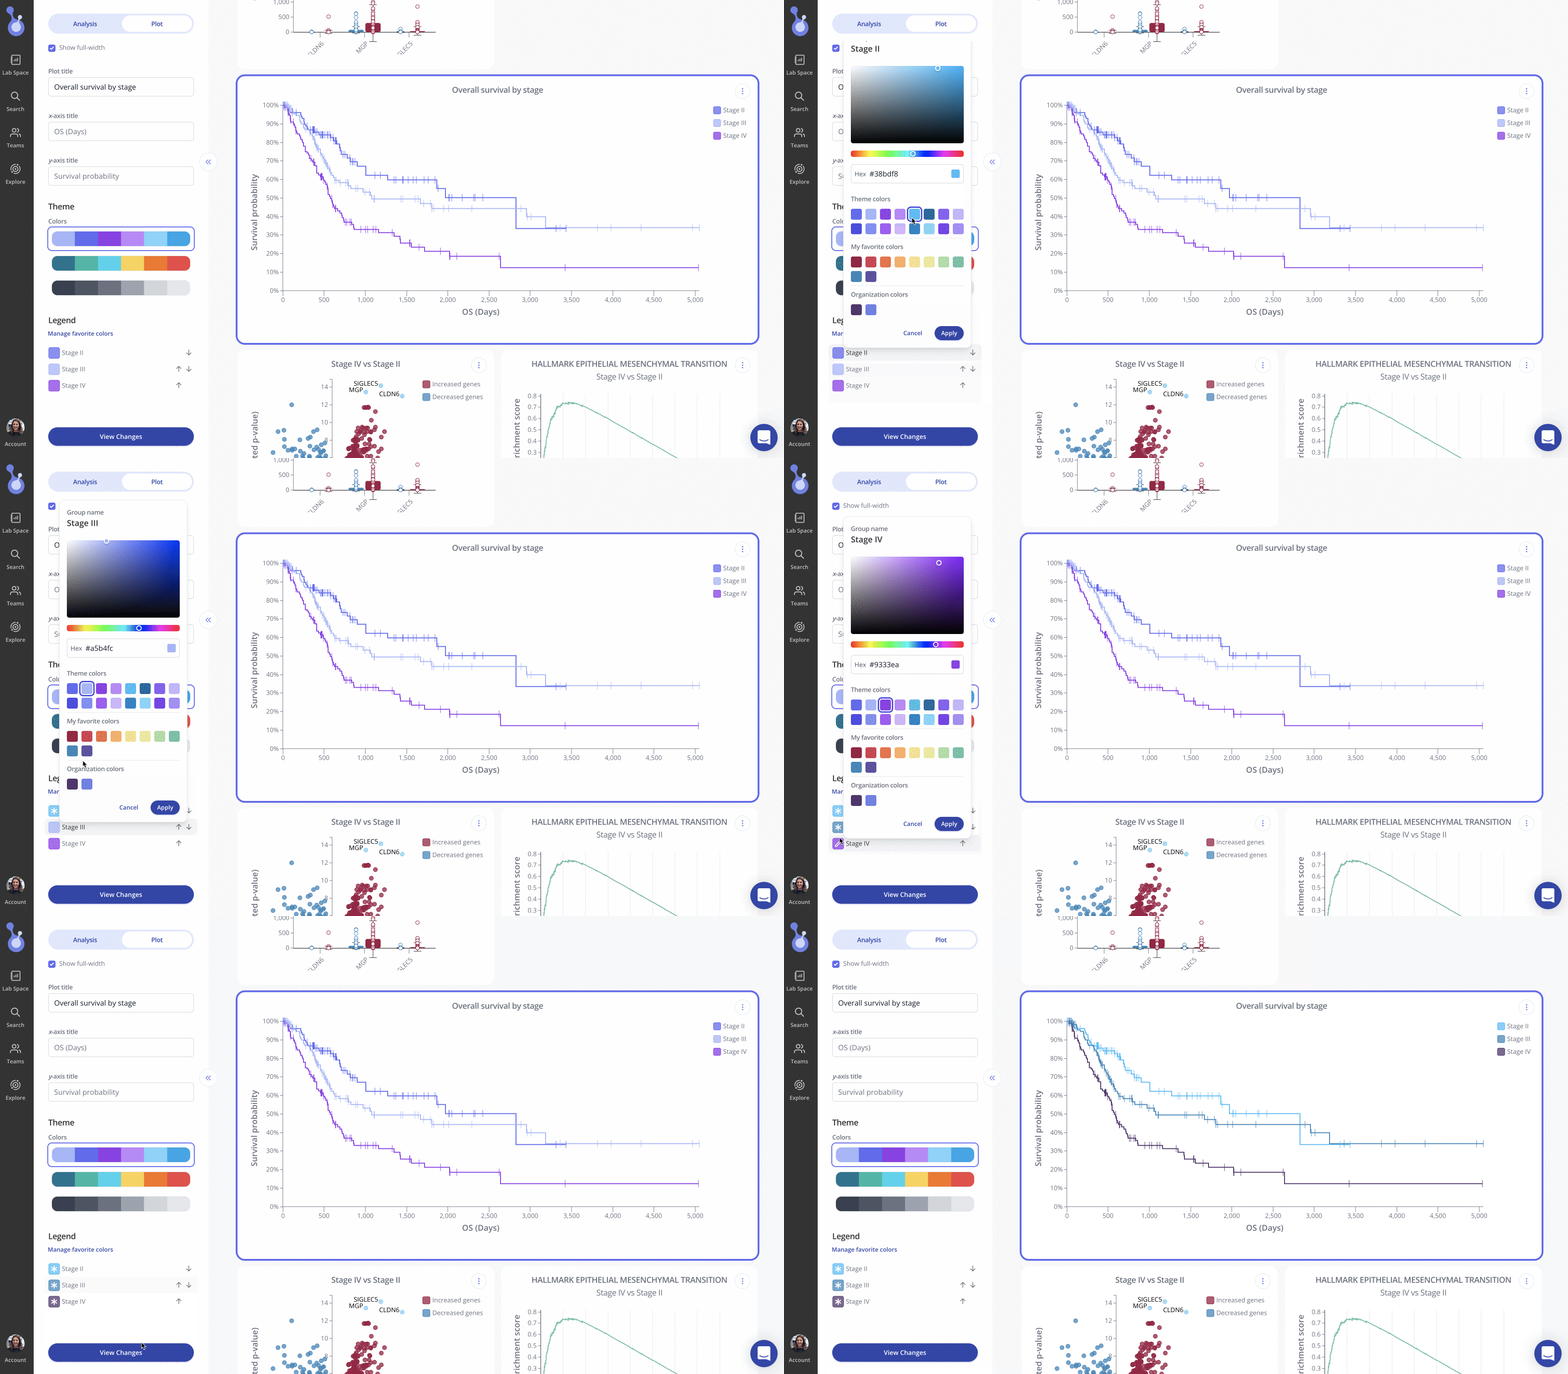
Open the "Edit Plot" menu and scroll down to the Legend section. Tap on the color chip for any group in the legend to open the color picker.

Select a color from the active theme, or from your favorite colors, or your organization's color palette. You can also use the gradient hue picker or manually enter a hex code.
When you are satisfied with the selected color, click "Apply" to close the color picker, and then tap "View Changes" in the lower left to see the updated theme applied to the plot.
Edit / Reorder Legends
To edit the display names of a plot legend, double click the plot you'd like to edit to open the "Edit Plot" menu, and scroll down to the "Legend" Section. To change to order of the Display Names, drag them into your desired position. To edit the display name, click the pencil icon, make the desired update, click "Apply", and finally, click "Save Changes at the bottom of the Edit Plot menu
IMPORTANT: Display names only apply to Groups, which are derived from values in the user-uploaded sample data. Below are the plot types where legends are not editable/orderable:
- Enrichment Plot
- Score barplot
- Volcano Plot
- Volcano Plot v2
- Image-heatmap
- Image- tornado
- Image-profile Plot
Ready to try it out on your data?
