Peak analysis
Last updated: June 4, 2025
Analyze peaks across the whole genome
This analysis will allow you to visualize genomic data originating from a variety of high throughput sources such as next generation sequencing and microarrays. Peak analysis outputs IGV plots which are useful for applications such as identifying gene expression patterns, genomic variation and analyzing epigenetic modifications.
Peak analysis can be carried out on Pluto with your own uploaded dataset or publicly available data.
Step-by-step tutorial
Overview
When the raw data (FASTQ files) from sequencing-based experiment types are run through their respective pipelines, bigWig files are produced. BigWig files are used for storing dense, continuous data that can be displayed in a genome browser. In a genome browser, each "track" represents a sample.
The name peak analysis refers to the characteristic peak-like shape that emerges on genome browsers displaying bigWig format data.
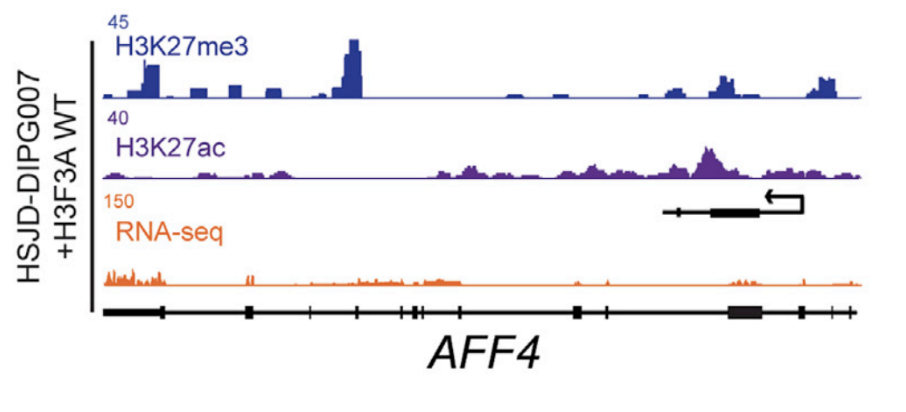
Image from Cell Reports .
Running peak analysis in Pluto
You can run peak analysis on experiments where FASTQ files were uploaded and processed via one of Pluto's pipelines. First, click the "+ Analysis" button in the upper right and select Peak Analysis.
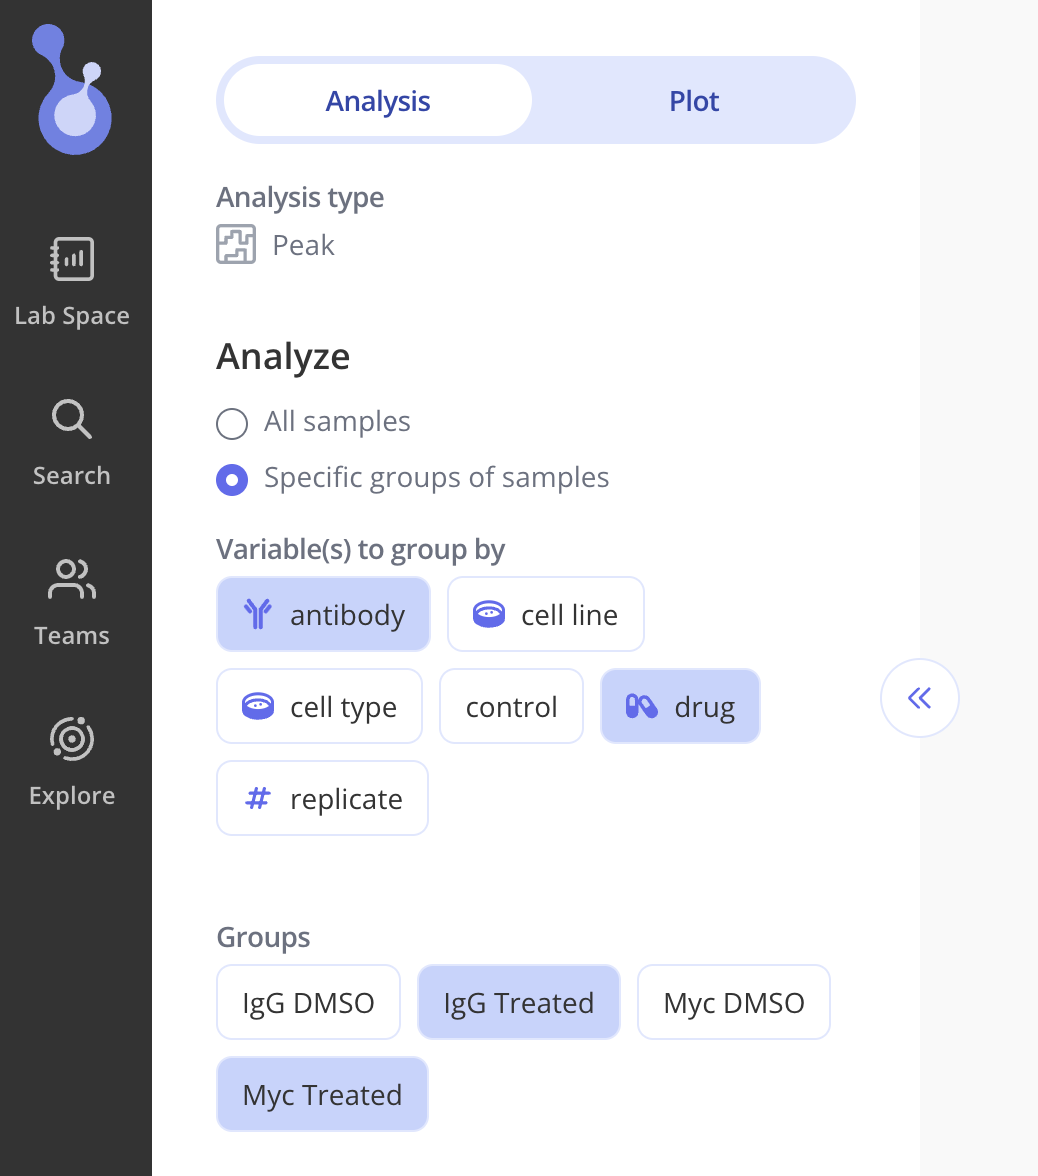
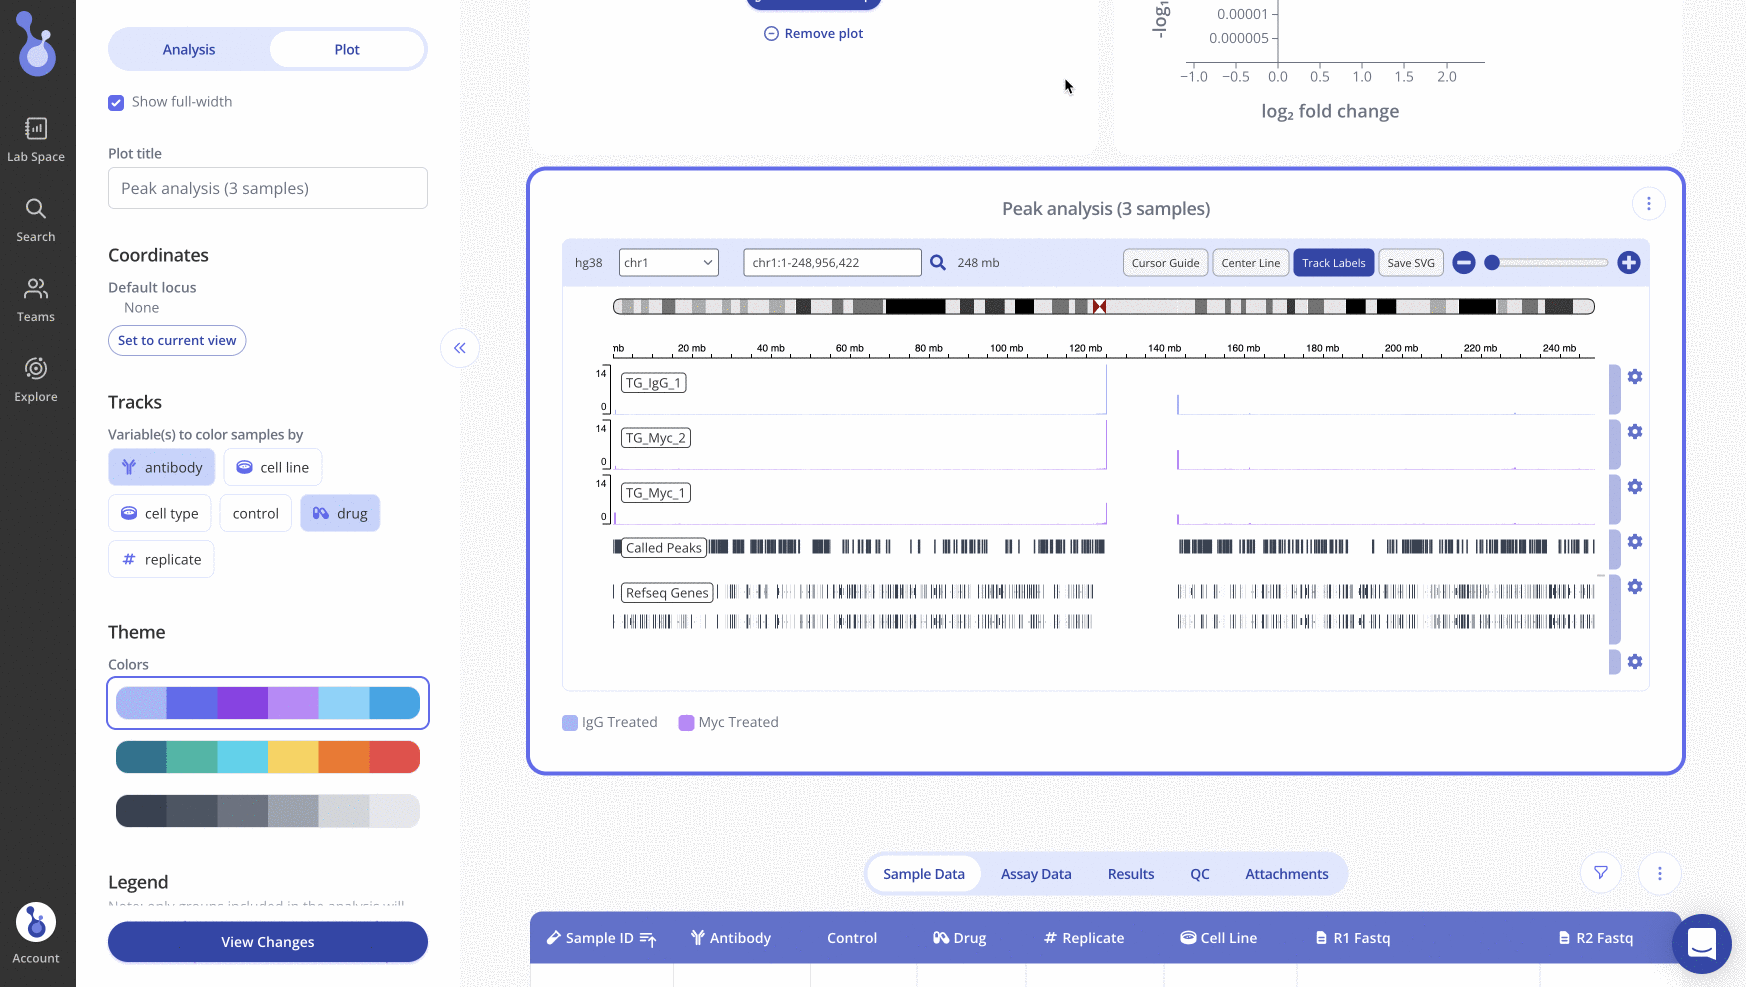
Set up your analysis either by including all samples, or by using your experimental variables to build groups, and selecting a subset that you'd like to include.
In the example below, we decided to group samples by Antibody and Drug, and selected 2 groups ("IgG Treated" and "Myc Treated") to include in our analysis.
Creating and customizing an IGV plot
By default, when your peak analysis runs, Pluto will display an IGV plot showing the first chromosome.
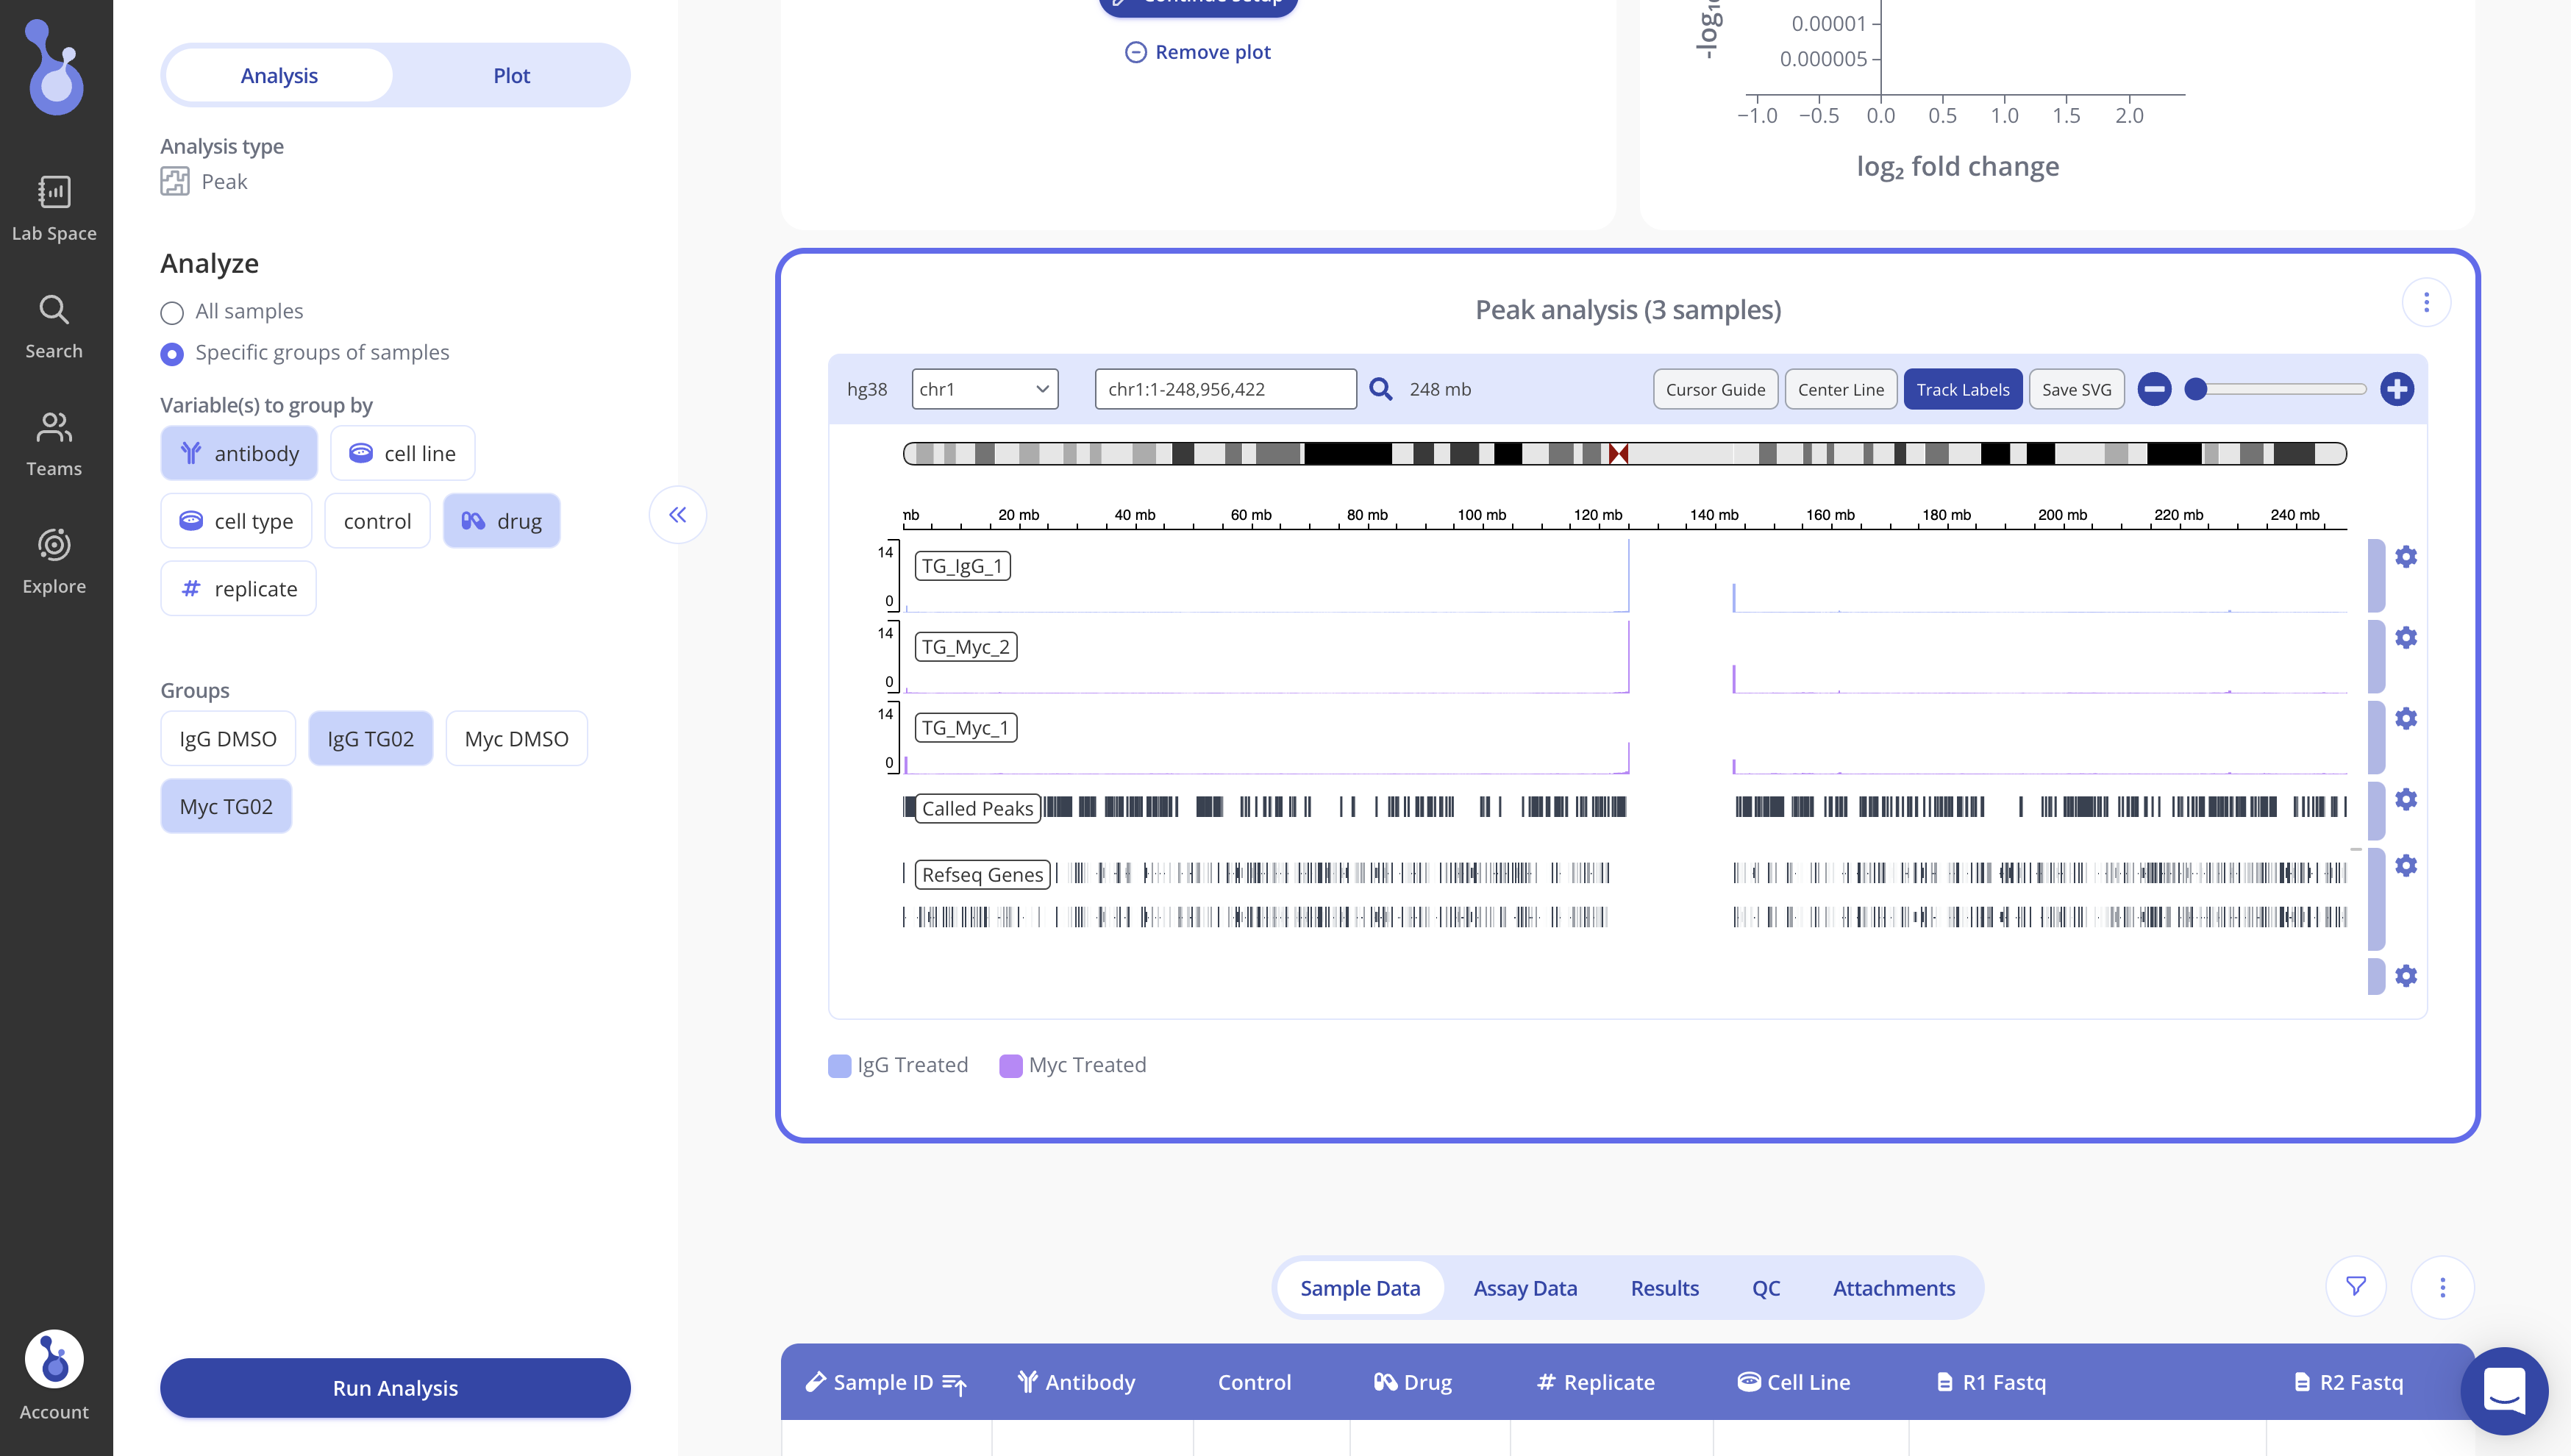
The top half of the IGV plot shows one track per sample that was included in the analysis.
To customize the plot appearance, select the Plot tab of the sidebar. Use the "Variables to color samples by" section of the sidebar to set groups to color by.
Search for a specific locus with the search bar above the IGV plot. Once you've positioned the IGV plot on the locus of interest, click "Set to current view" in the sidebar and click "View changes" to save all appearance changes. When you return to the experiment page later, the IGV plot will show the locus that you set as the default.
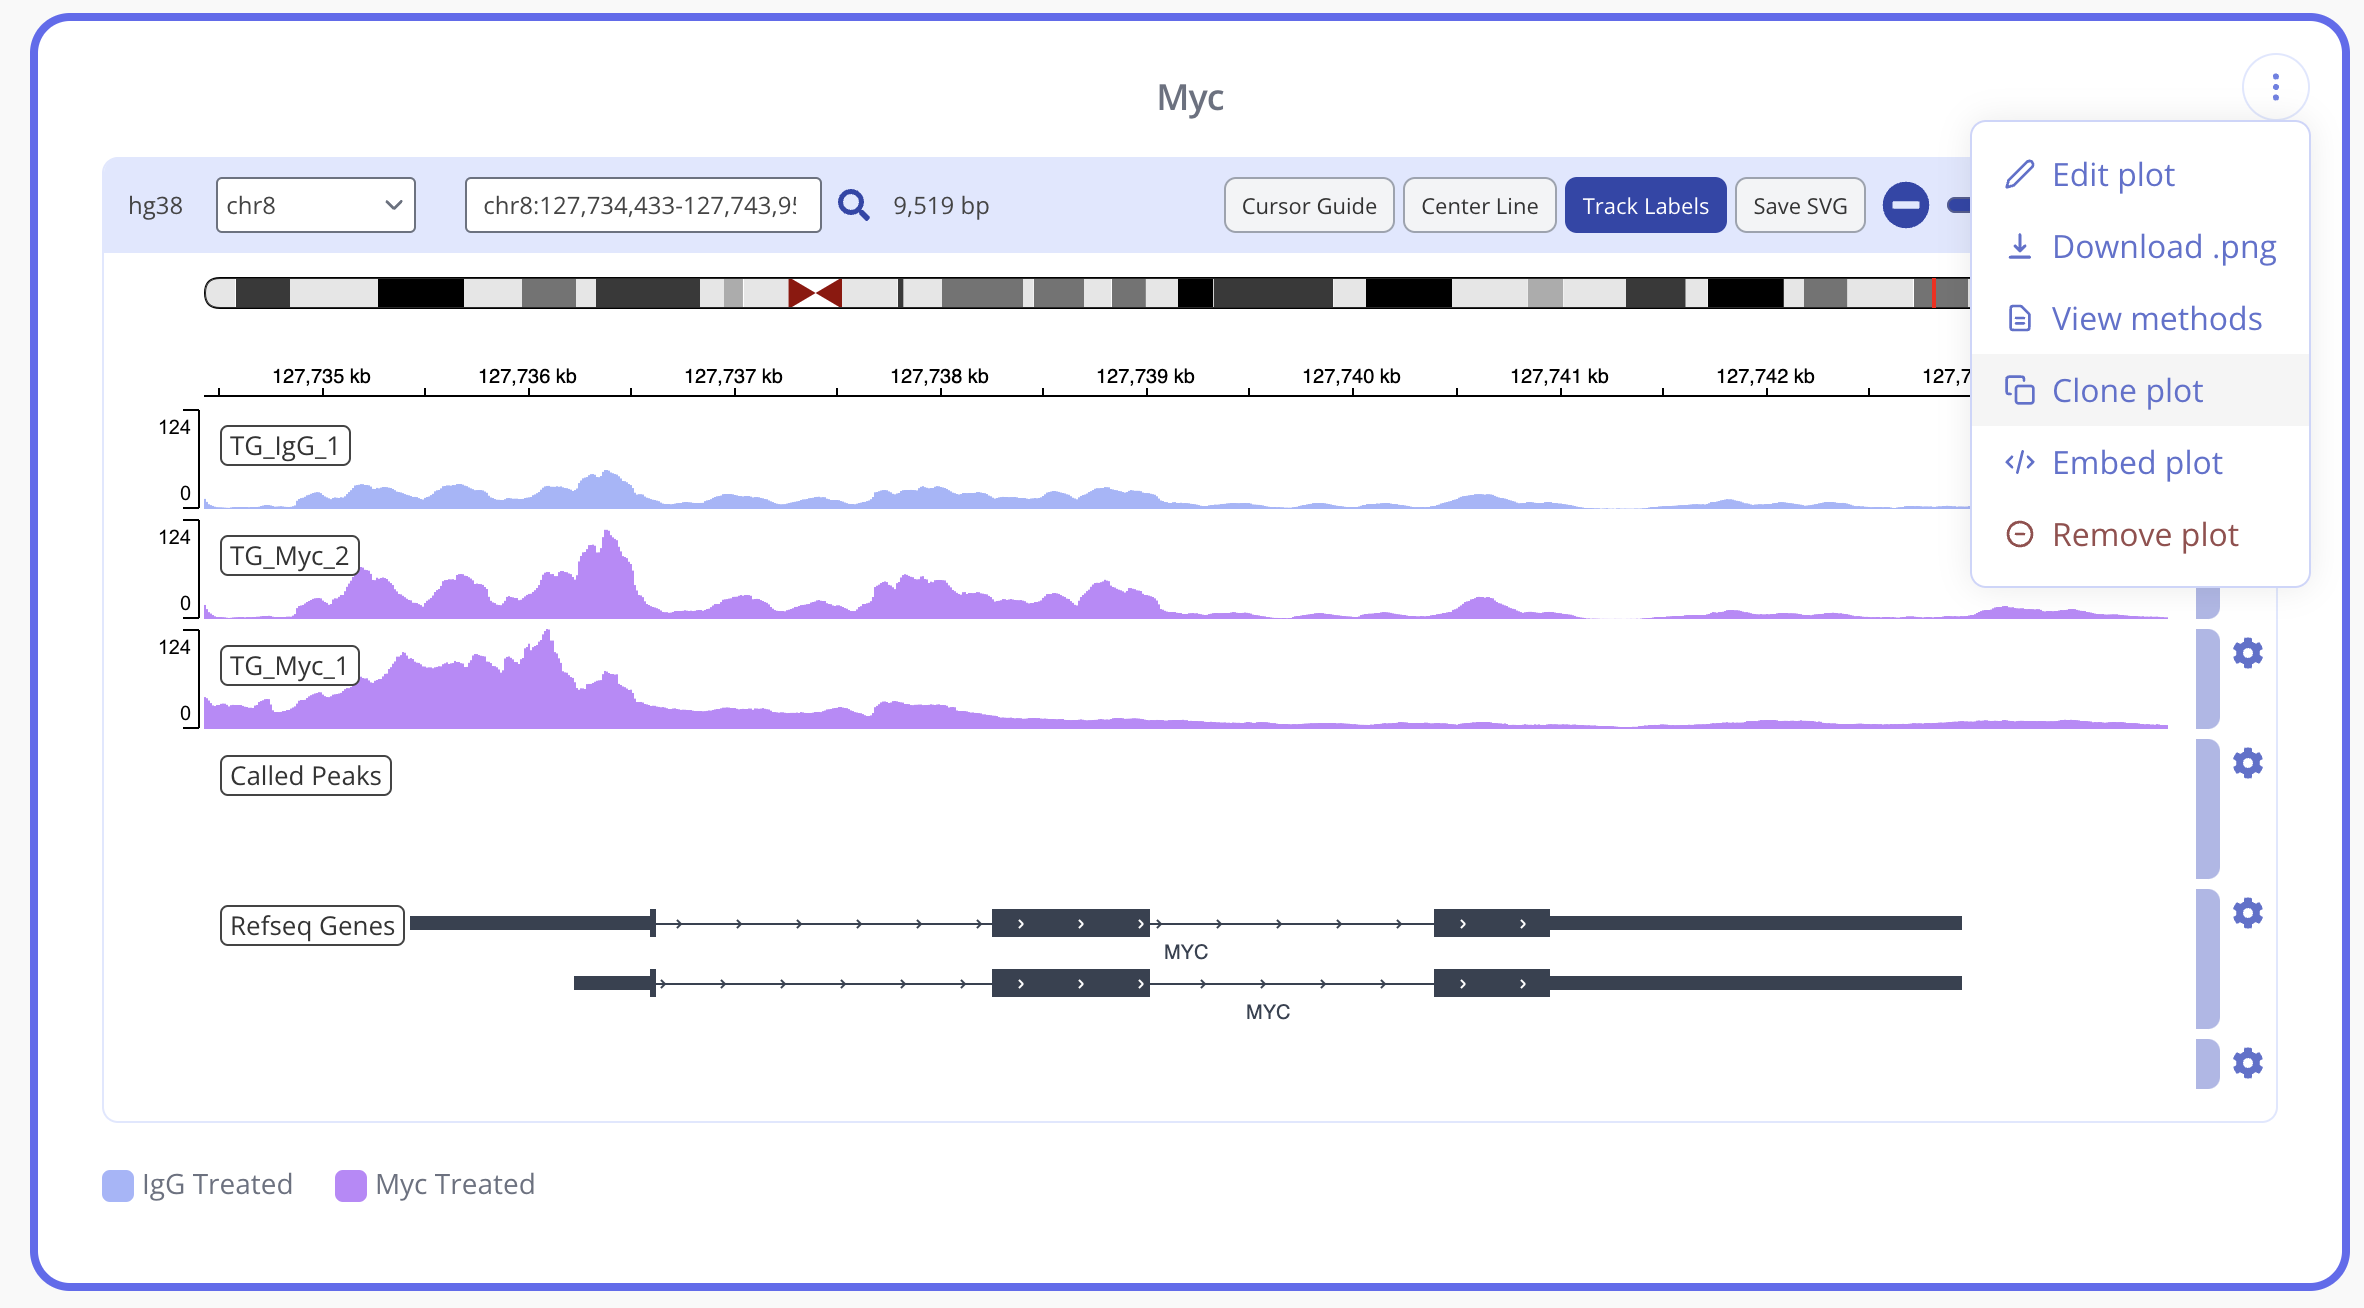
To easily create another IGV plot for a different locus while keeping your appearance settings, use the clone plot button to create a duplicate IGV plot to edit.
Ready to try it out on your data?