Filter gene sets by adjusted p-value and normalized enrichment score for display on a score barplot
After running gene set enrichment analysis (GSEA) in Pluto, you can display the normalized enrichment scores (NES) for a subset of gene sets using a Score Barplot.

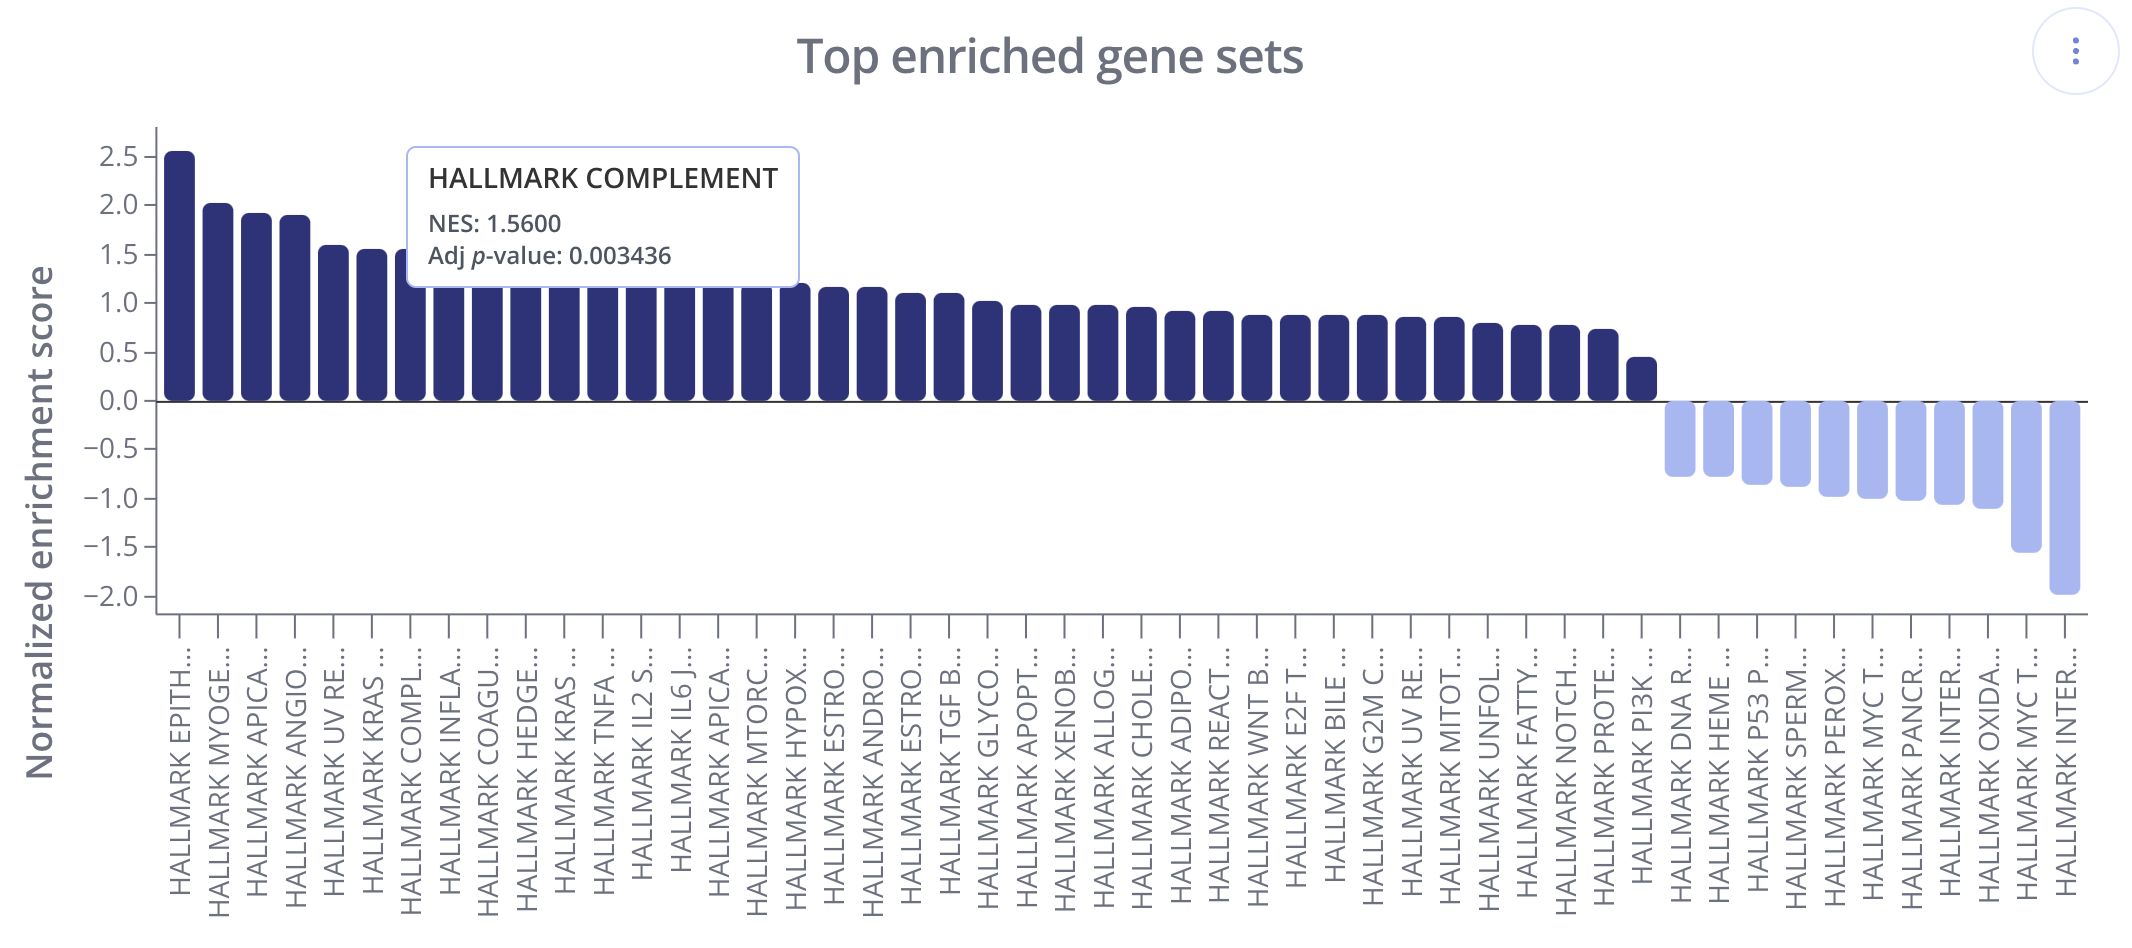
In these plots, gene sets (x-axis) are ranked and displayed according to the NES values (y-axis). Positively enriched gene sets (NES value > 0) are shown in the dark navy color above, and negatively enriched gene sets (NES value < 0) are shown below the x=0 line in a light blue color.
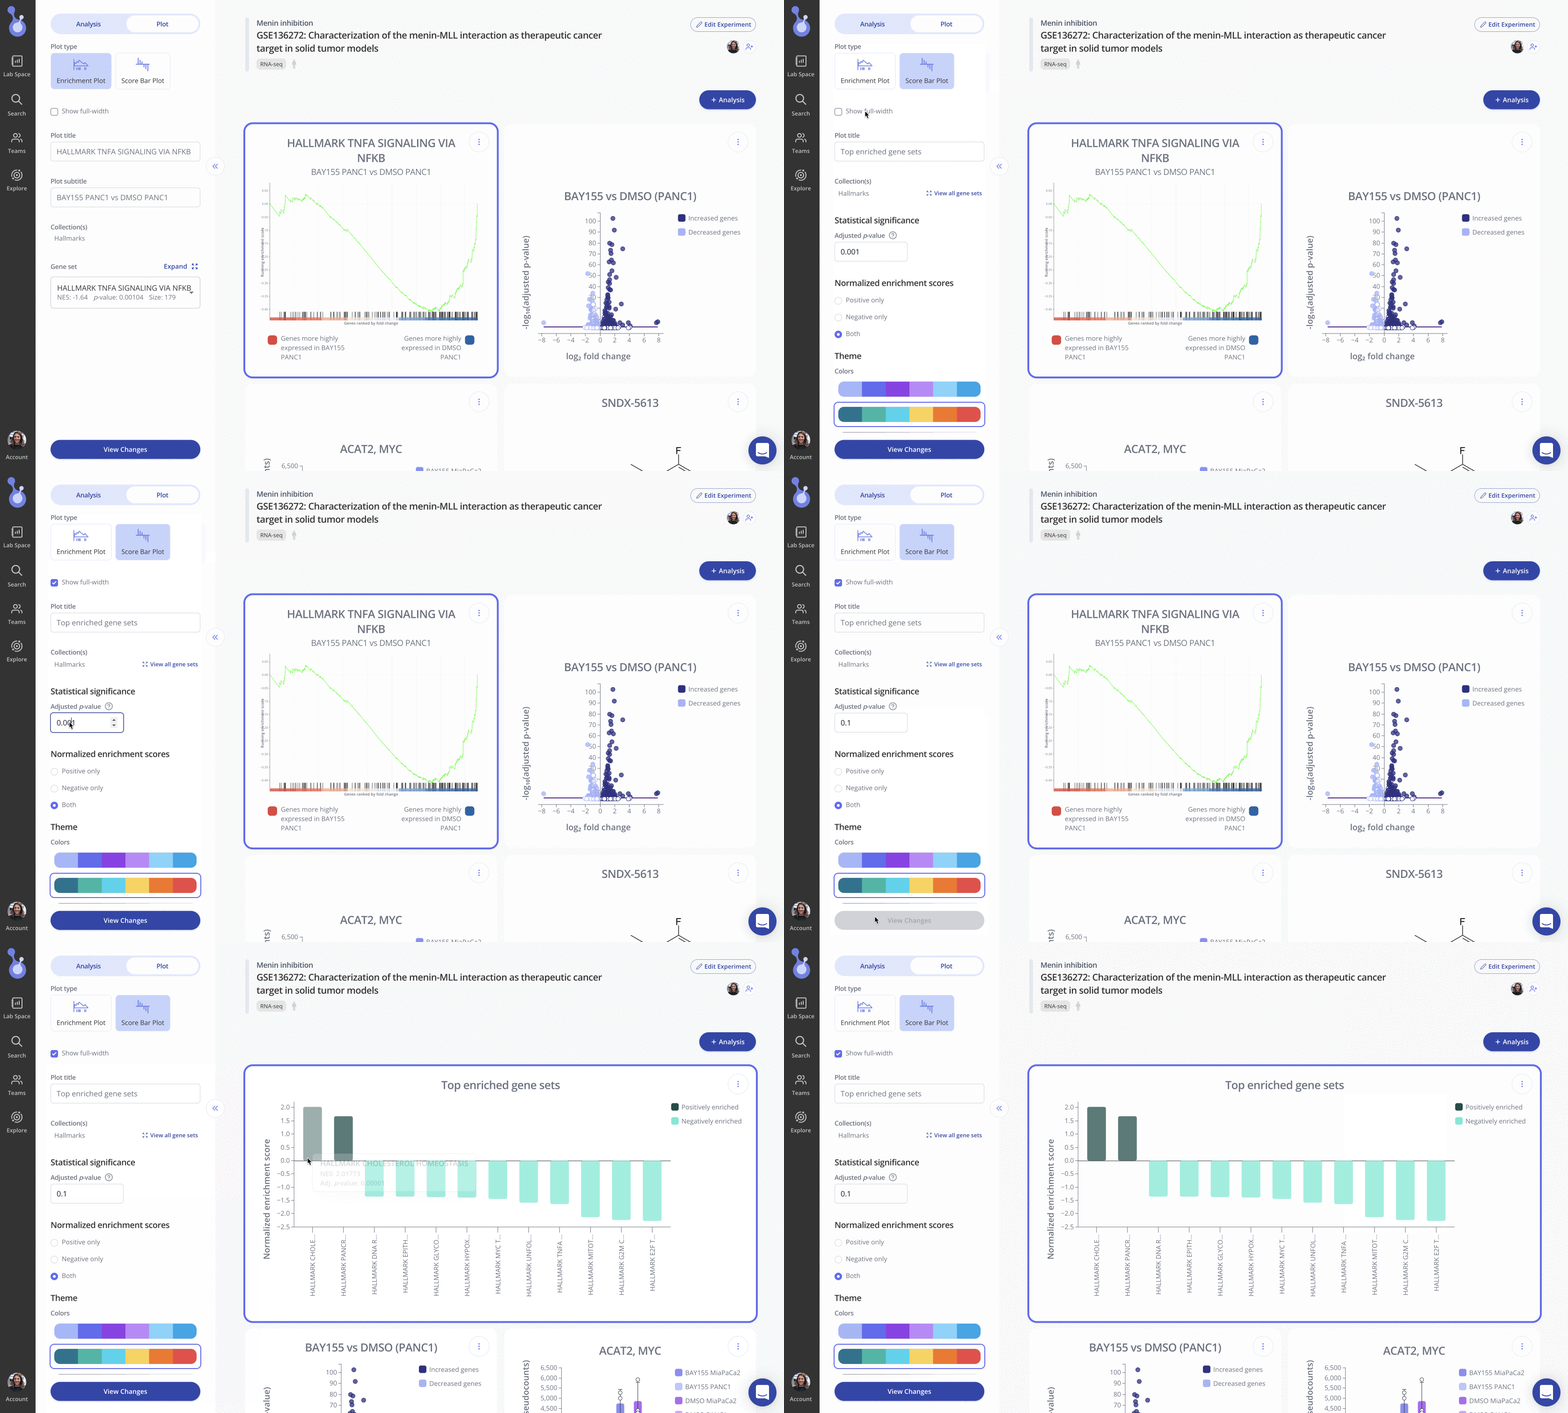
To create this plot, choose the Score Bar Plot plot type from the "Edit Plot" menu. Optionally check the box to show the plot as full-width, and filter gene sets by their adjusted p-value and/or NES value. Click "View Changes" to view your plot.

To customize the gene sets shown on the Score Barplot, you can set a filter by adjusted p-value and/or NES value.
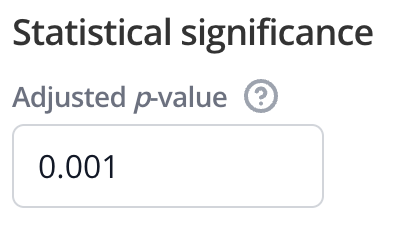
Use the Statistical significance section of the Edit Plot menu to set a threshold for the gene sets' adjusted p-value. For example, if you set a threshold of 0.001, then only gene sets with an adjusted p-value of less than or equal to 0.001 will be shown.

To show any gene sets regardless of adjusted p-value, you can set the adjusted p-value threshold to 1. This will display all gene sets that have any numeric value (i.e. not NA) for their adjusted p-value.
Subset gene sets by normalized enrichment score
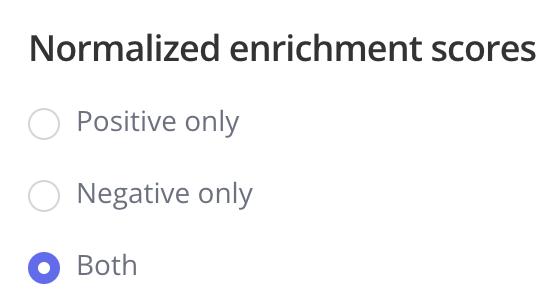
Use the Normalized enrichment scores section of the Edit Plot menu to subset gene sets by the direction of their calculated enrichment score.

Selecting "Positive only" will result in the score barplot showing only positively enriched gene sets that had an NES value > 0. Selecting "Negative only" will result in the score barplot showing only negatively enriched gene sets that had an NES value < 0. Selecting "Both" will not do any filtering of gene sets based on NES value and any gene sets with a numeric (i.e. not NA) value will be shown.
Subsetting by both statistical significance and normalized enrichment score
Note that the two options above for filtering gene sets are combined with AND logic.
Ready to try it out on your data?
