Overview of data formatting and methods for survival analysis
Background
Data formatting requirements
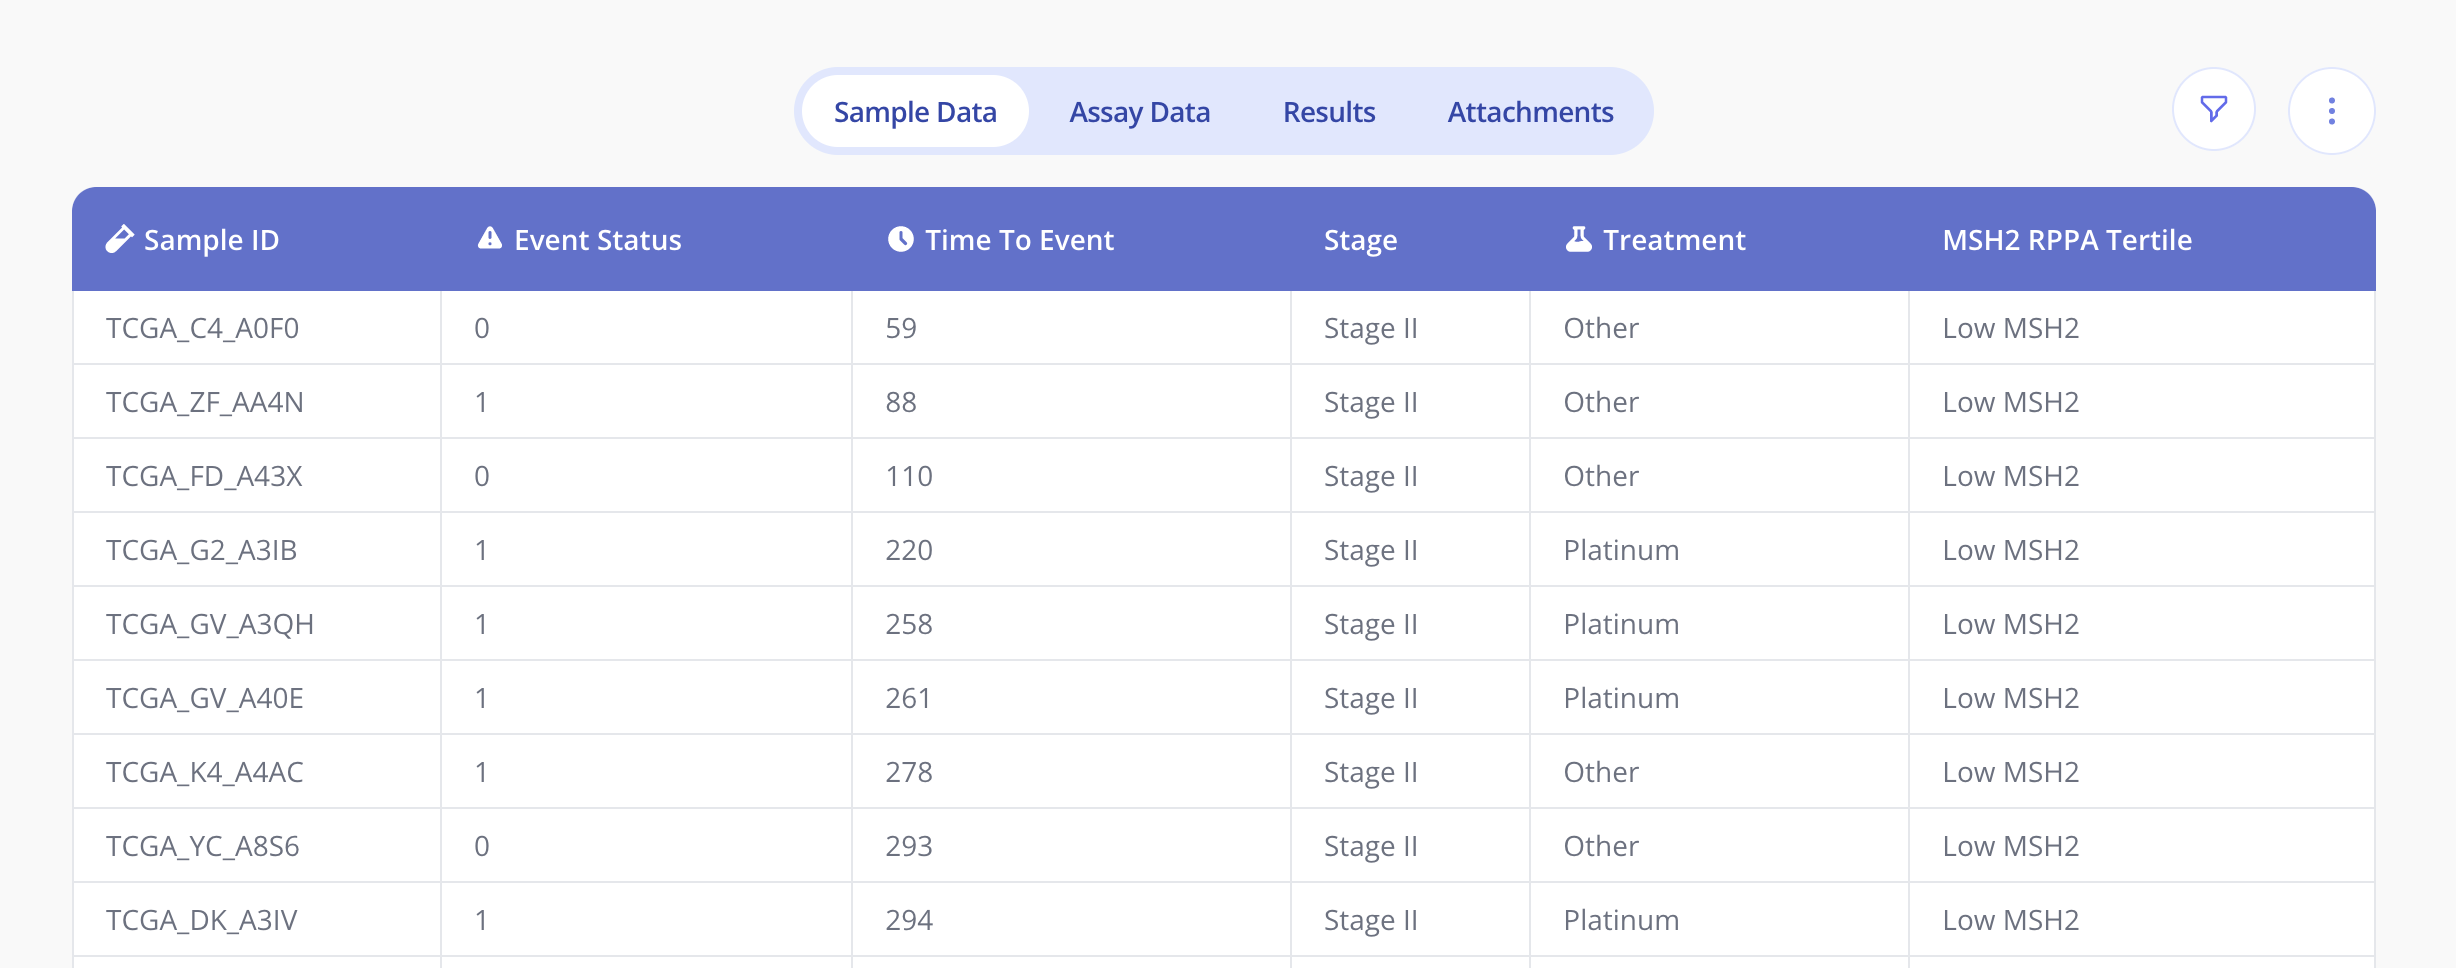
To run survival analysis in Pluto, you'll need to include two special columns in your sample data table:
-
Status - Boolean values only (0/1) representing whether an event has occured
-
Time to event - Numeric values only, indicating the time to an event

Create an experiment in Pluto and upload your sample data table containing these columns. Upload the corresponding assay data for the experiment as normal.
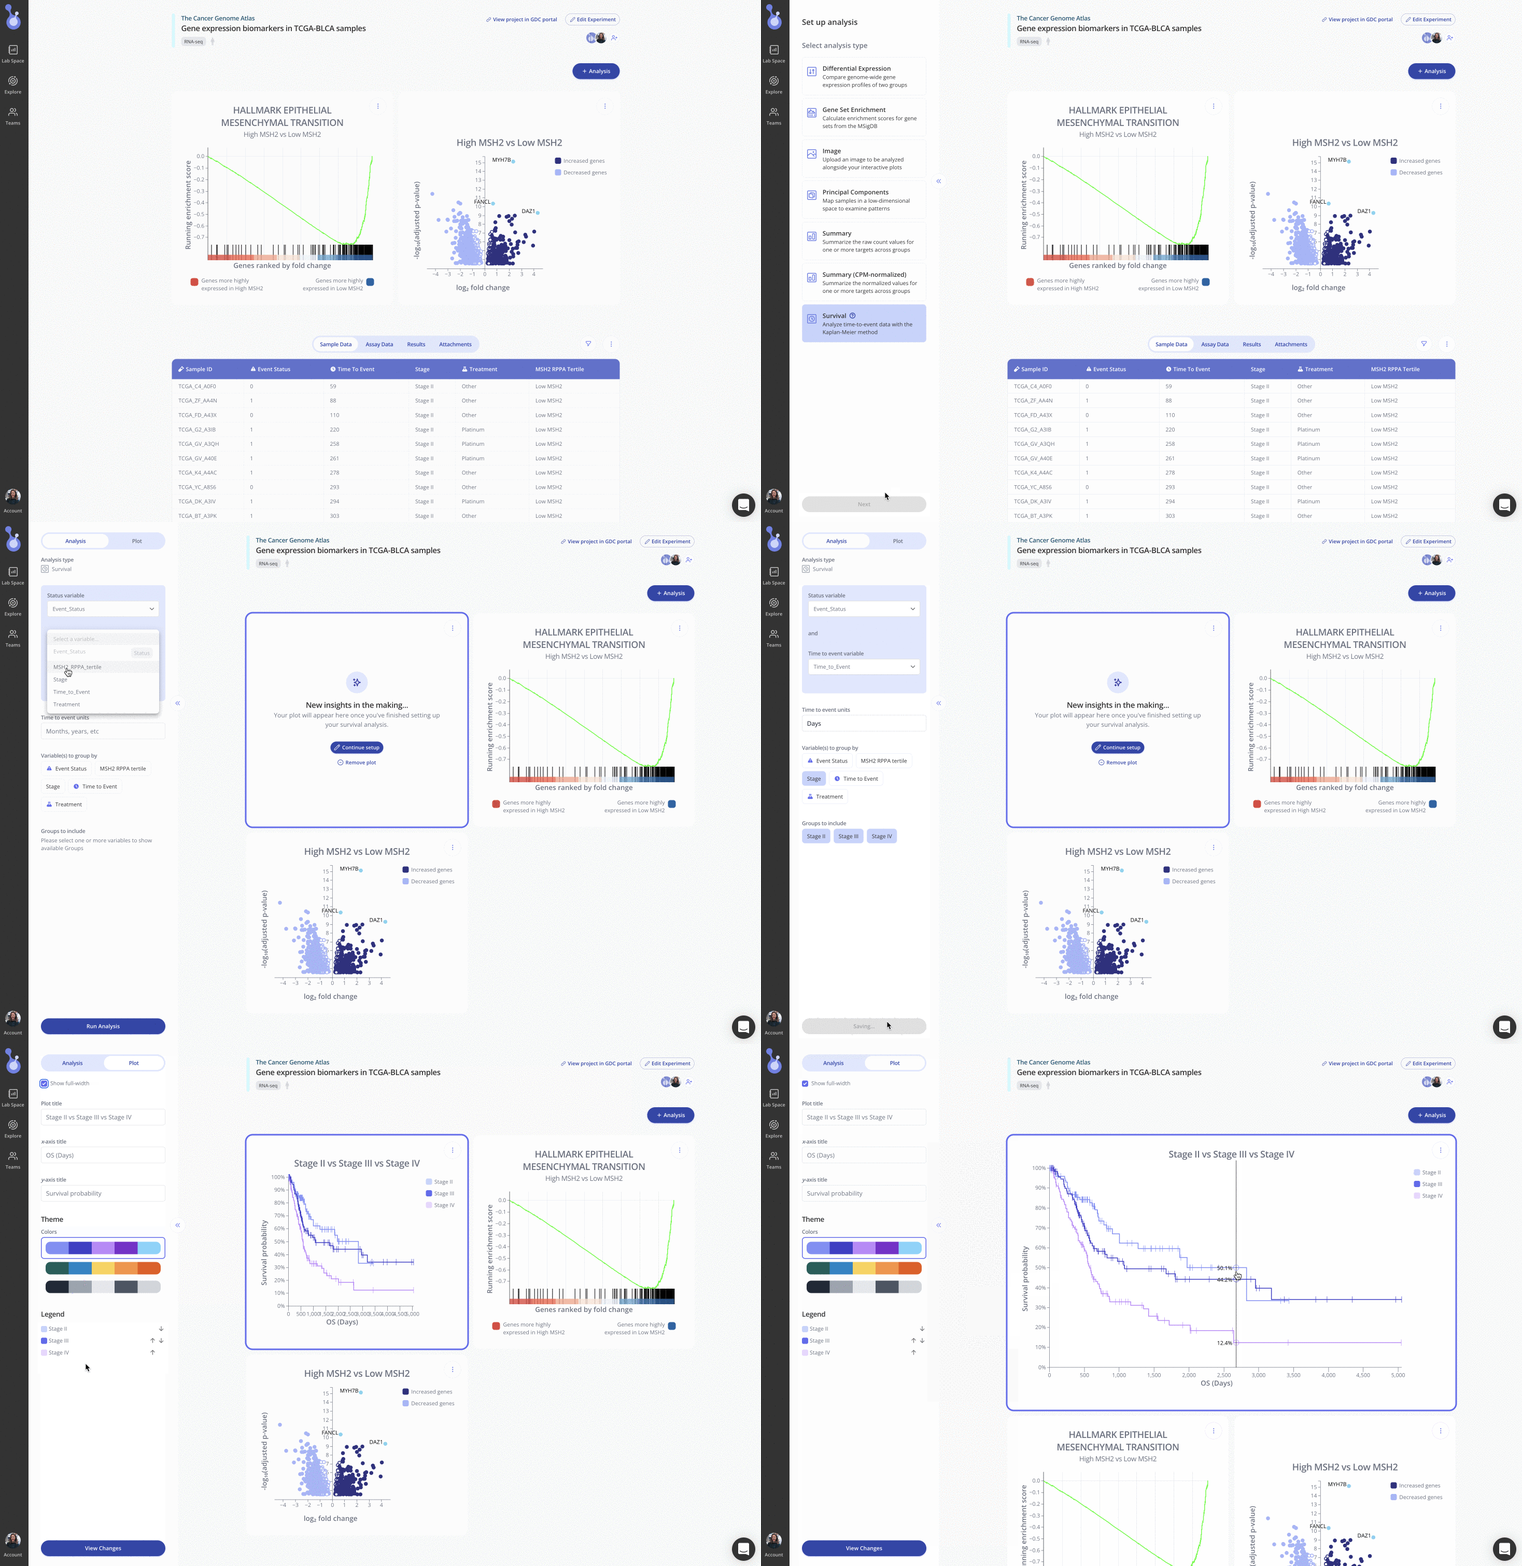
Run survival analysis using the Kaplan-Meier method
Contact your Pluto rep to have this analysis type enabled in your Lab Space, if needed. Then, click "+ Analysis" and select the Survival option.

Select the names of the columns in your sample data table containing the Status and Time to Event data, and then select one or more variables to group patients by. Select the groups to include in your analysis, and click Run Analysis.
Use the Plot menu to customize the Kaplan-Meier plot or expand it to full-width.
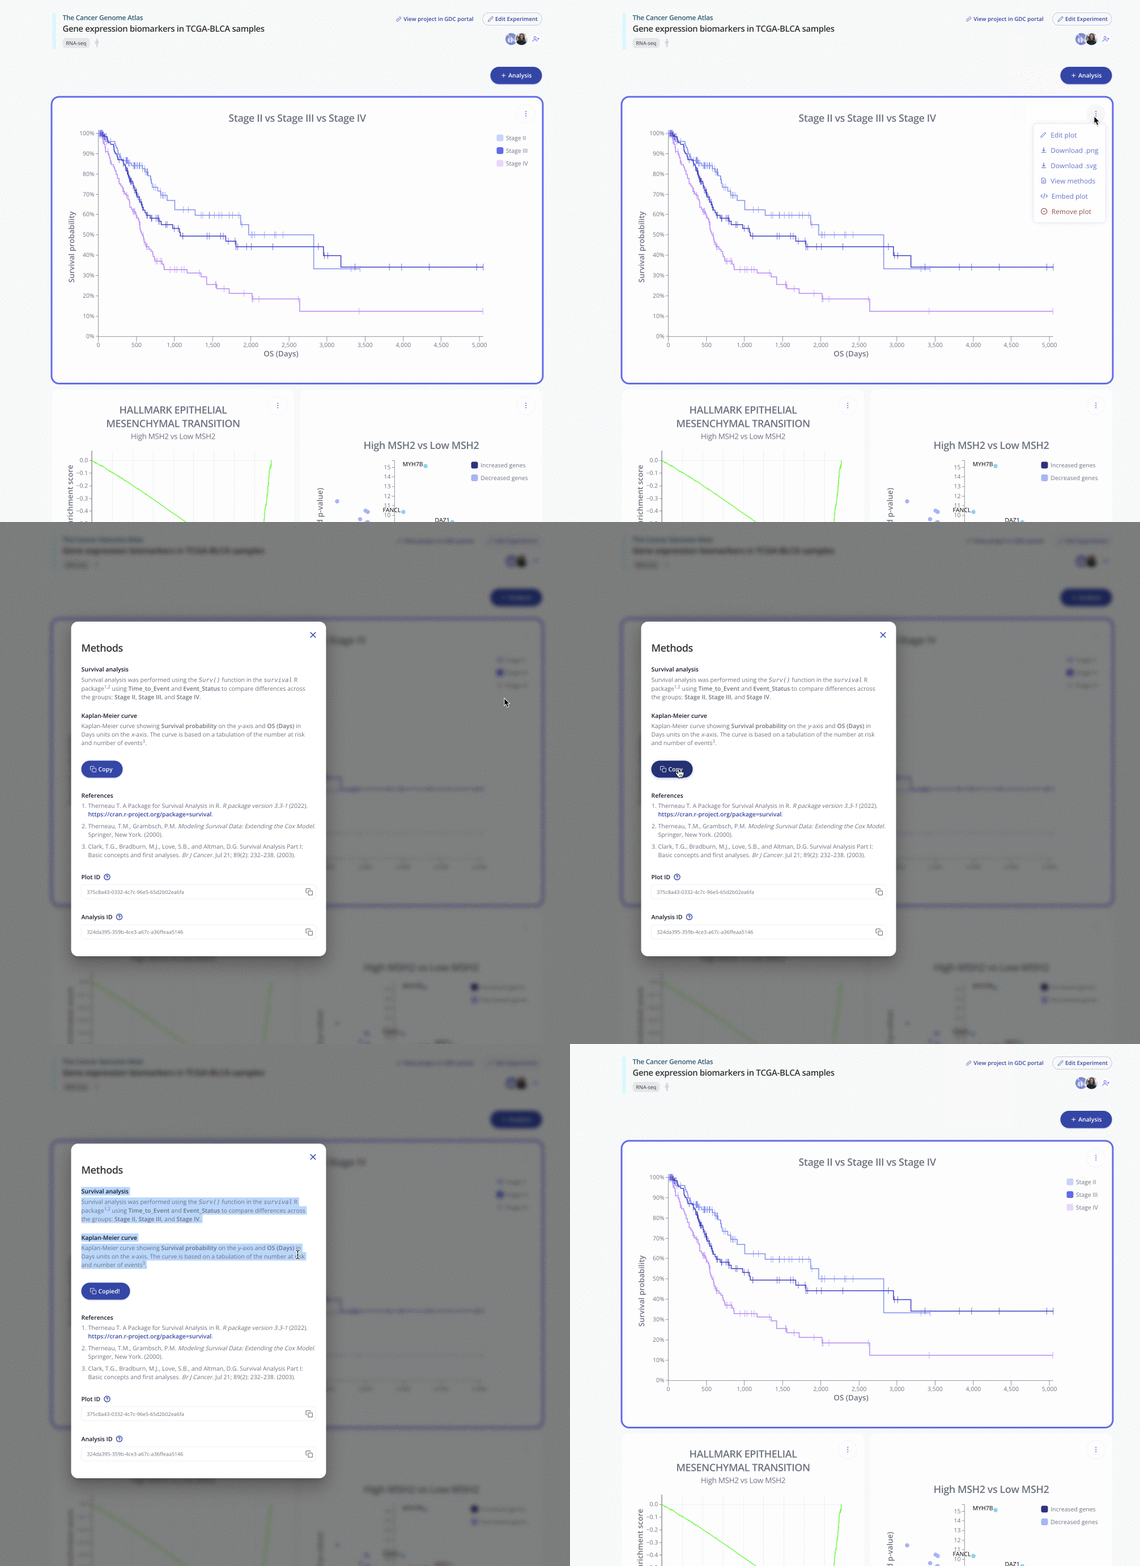
The methods for the survival analysis pipeline can be viewed by clicking the "..." menu and selecting the View Methods option.

References
-
Therneau T. A Package for Survival Analysis in R. R package version 3.3-1. (2022).https://CRAN.R-project.org/package=survival.
-
Therneau, T.M., Grambsch, P.M. Modeling Survival Data: Extending the Cox Model. Springer, New York. (2000).
-
Clark, T.G., Bradburn, M.J., Love, S.B., and Altman, D.G. Survival Analysis Part I: Basic concepts and first analyses. Br J Cancer. Jul 21; 89(2): 232–238. (2003).
