Compare genome-wide gene expression profiles across two groups
Step-by-step tutorial

Video tutorial
Differential expression analysis is a common method for analyzing genome-wide gene expression changes between conditions. For each gene, differential expression analysis outputs a fold change (measure of magnitude of change) and an adjusted p-value (measure of statistical significance of change).
* Important note - differential expression analysis can be performed on raw and expected counts, but cannot be performed on any “normalized” units like TPM or FPKM, as it is not statistically valid to use normalized data as an input into differential expression.
Overview
Set up your analysis
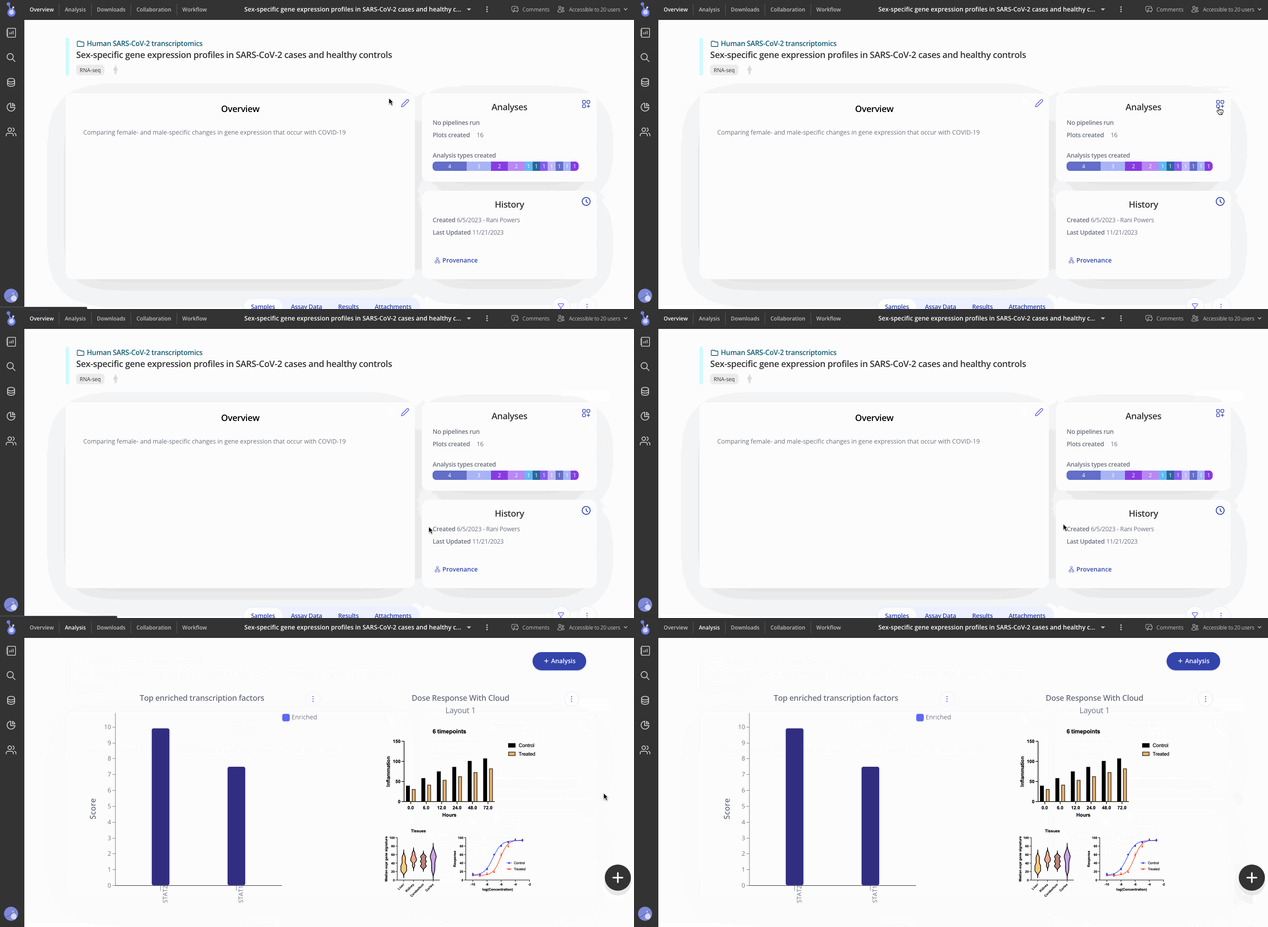
Navigate to your experiment and open the analysis tab by clicking "Analysis" on the top navigation bar or the + button next to the "Analyses" summary on your experiment page.
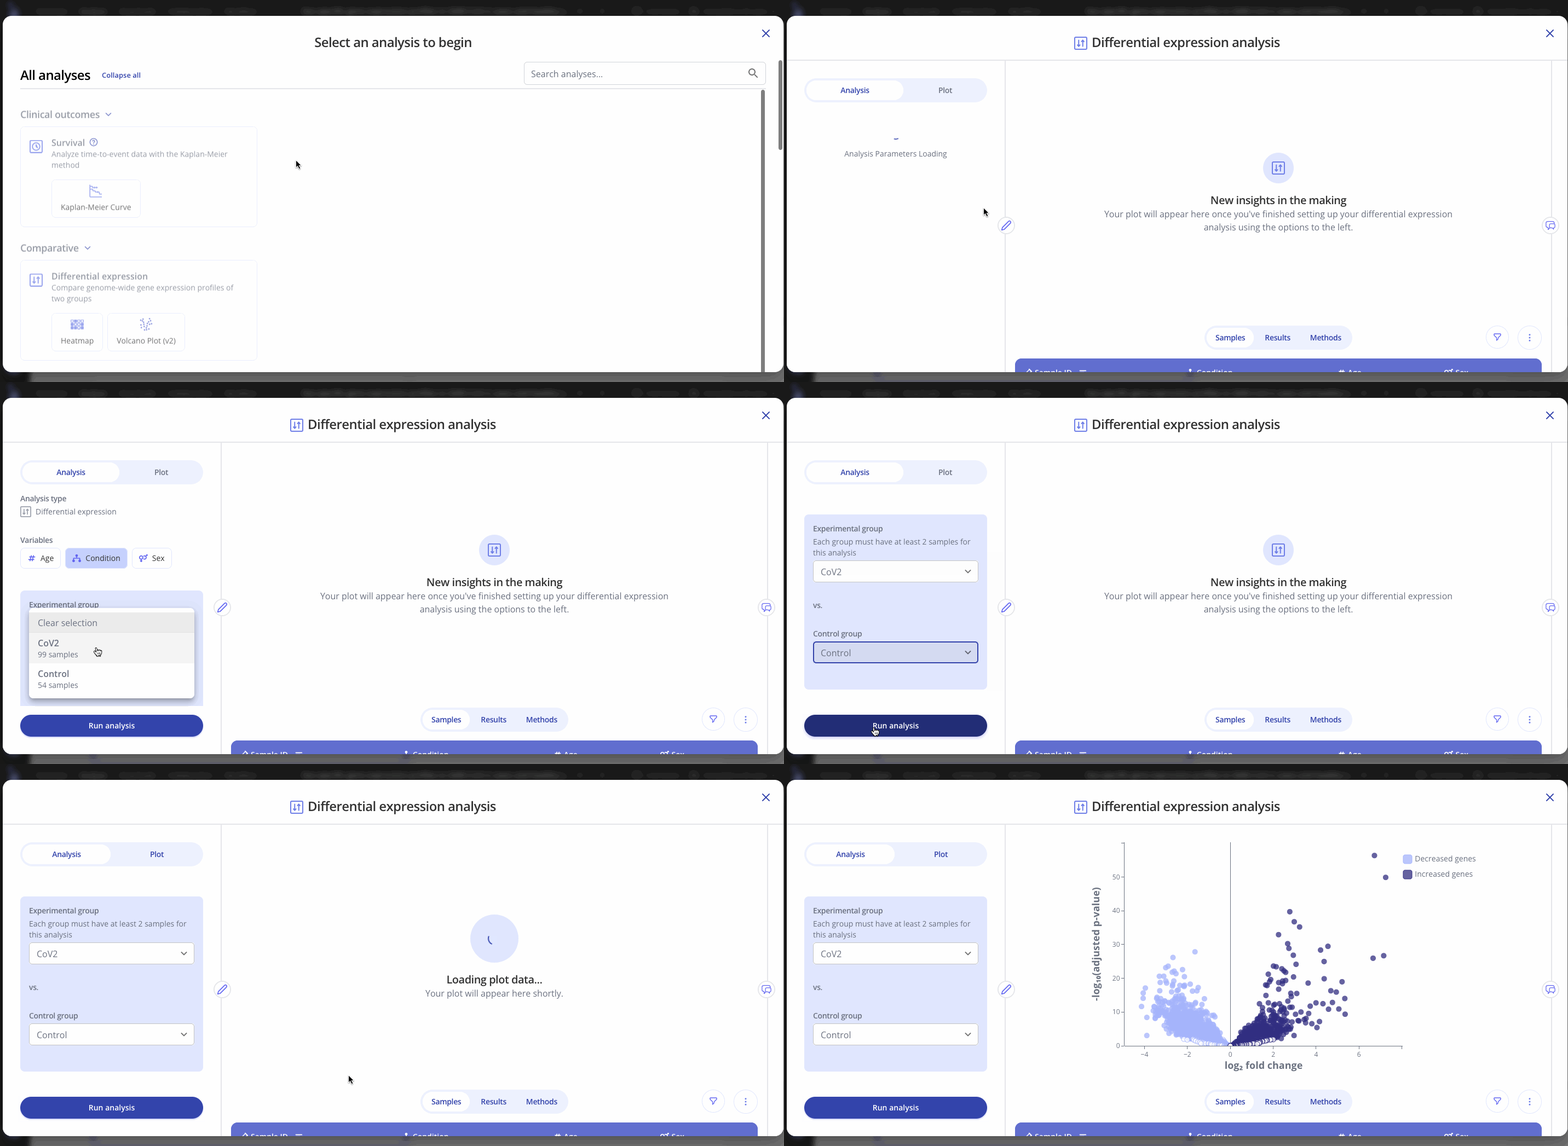
While viewing your experiment, click "+ Analysis" and select Differential expression analysis and select your plot type.
For a volcano plot, select one or more Variables to group your samples by. These variables are data-driven, and depend on the columns in your Sample Data. Learn more.
Select one of the resulting groups to be the Experimental Group and one group to be the Control Group. Click the "Run Analysis" button to begin running differential expression analysis with the parameters you set above
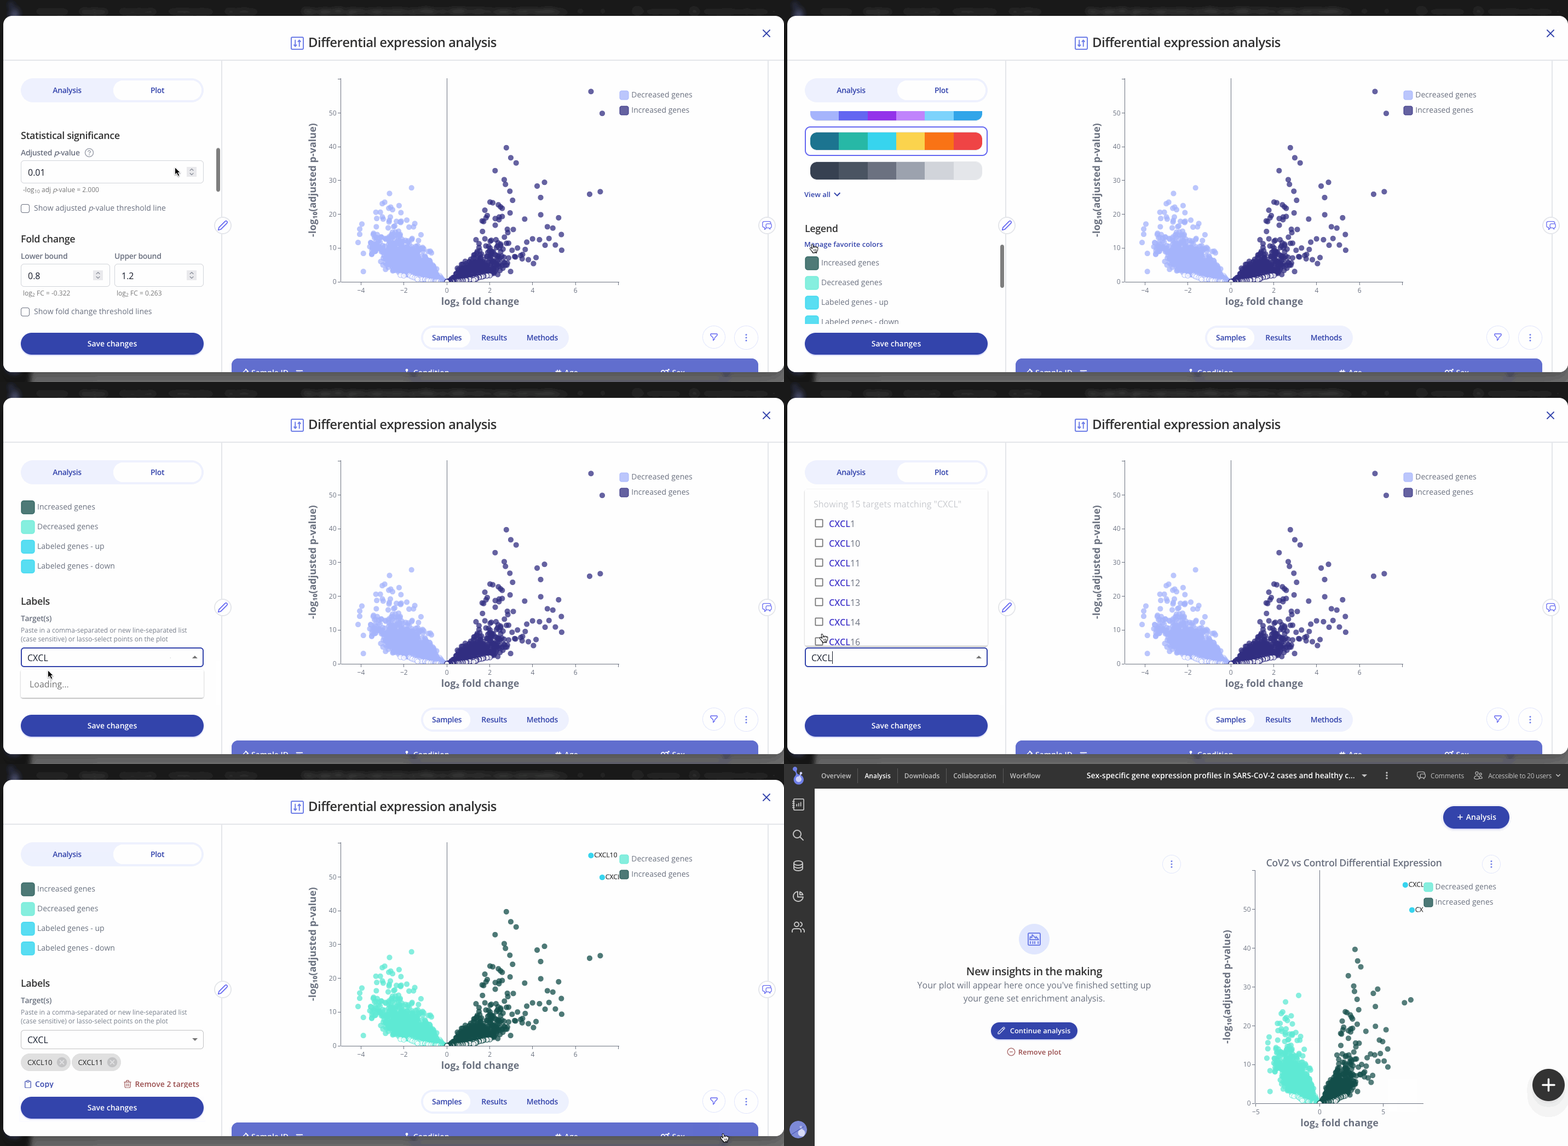
To visualize these results as a heat map, once the analysis is finished running, you can navigate to the plot tab to change the plot from a volcano to a heat map. Then, select your heat map color scheme and save your changes. 
Customize your plots
Use the Plot tab to customize the title, color palette, and other characteristics of the plot that you created from the differential expression analysis. You can also select and label specific genes of interest on your plot. Press save to apply your changes.

Note: Analysis and plot parameters may vary from the examples above, depending on your organization's configuration. Contact your Pluto representative by email or using our in-app chat if you have any questions.
Learn more about Pluto data visualizations here.
