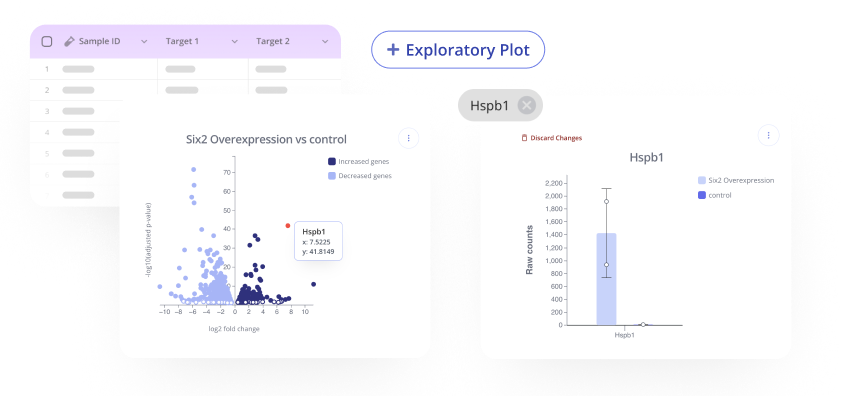
Interactively perform your own analysis and create new plots for any published experiment
Have you ever been reading a paper & wished that you could actually interact with the data/figures? Or wanted to dive into the raw data to find a result that could be relevant to your own research?

Pluto has thousands of published experiments that are available to explore interactively!
On the Explore tab, enter a search term relevant to your research interests and select an experiment to begin exploring.
Then, visit the Explore page to browse published experiments. For an explanation of how to search, check out the introduction to exploring published experiments.
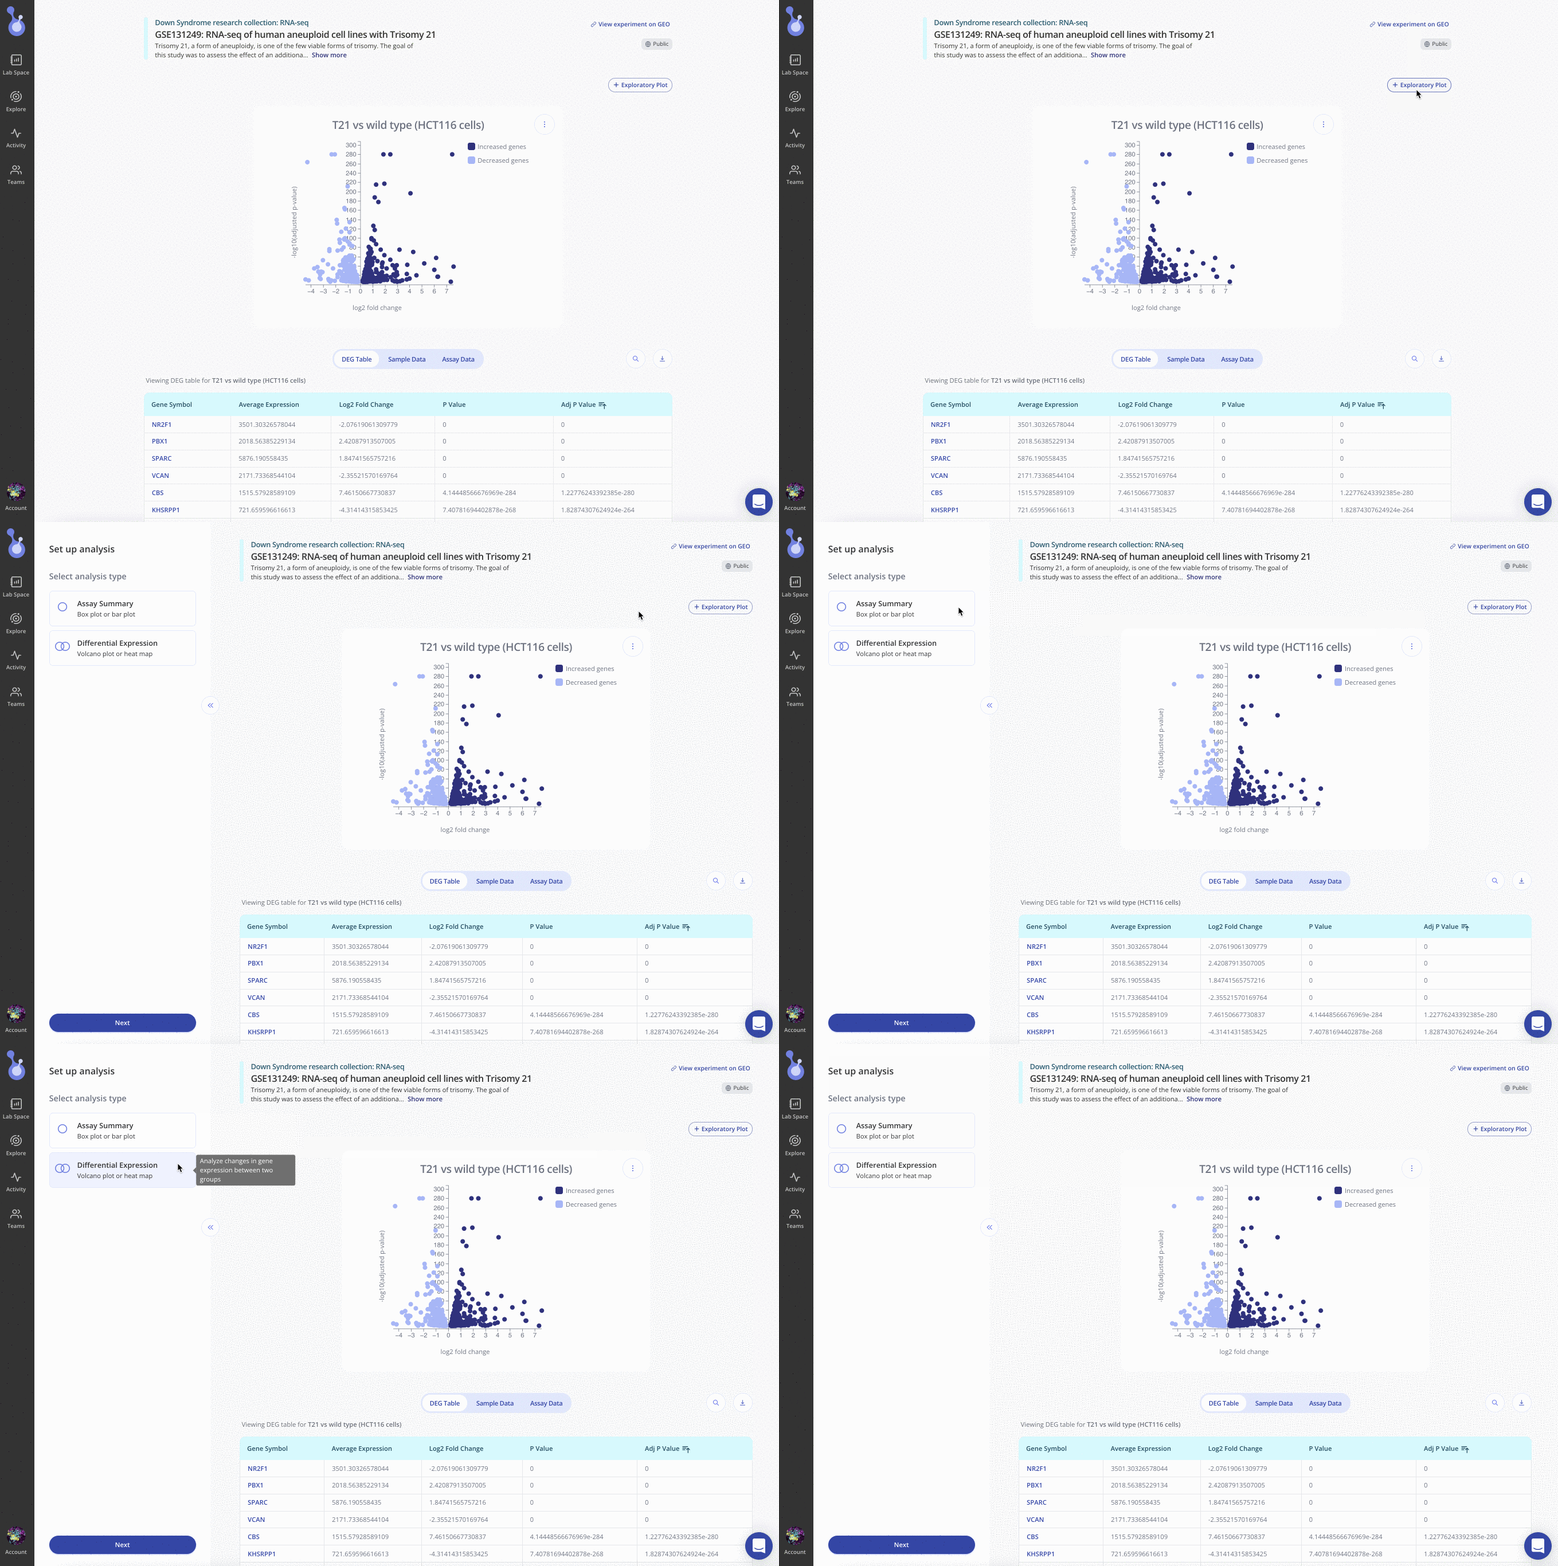
First thing's first! Once you've identified an experiment you'd like to analyze, click on the "+ Exploratory Plot" button in the upper right on the experiment page to create your own exploratory plot.
A sidebar will open up on the left side of the page and you'll be prompted to select an analysis to perform. The types of analyses available will depend on the experiment type.

Analysis types in Pluto
1. Assay summary
Select this option to simply summarize the data points generated in the experiment, without performing any major calculations with the data.
The types of plots you'll be able to create from this analysis include:
-
Barplot
-
Boxplot
The types of statistics you'll be able to run from this analysis include:
-
Student's t-test
-
ANOVA
-
Kruskal-Wallis H-test
For more details on the statistical tests available in Pluto, check out this article.
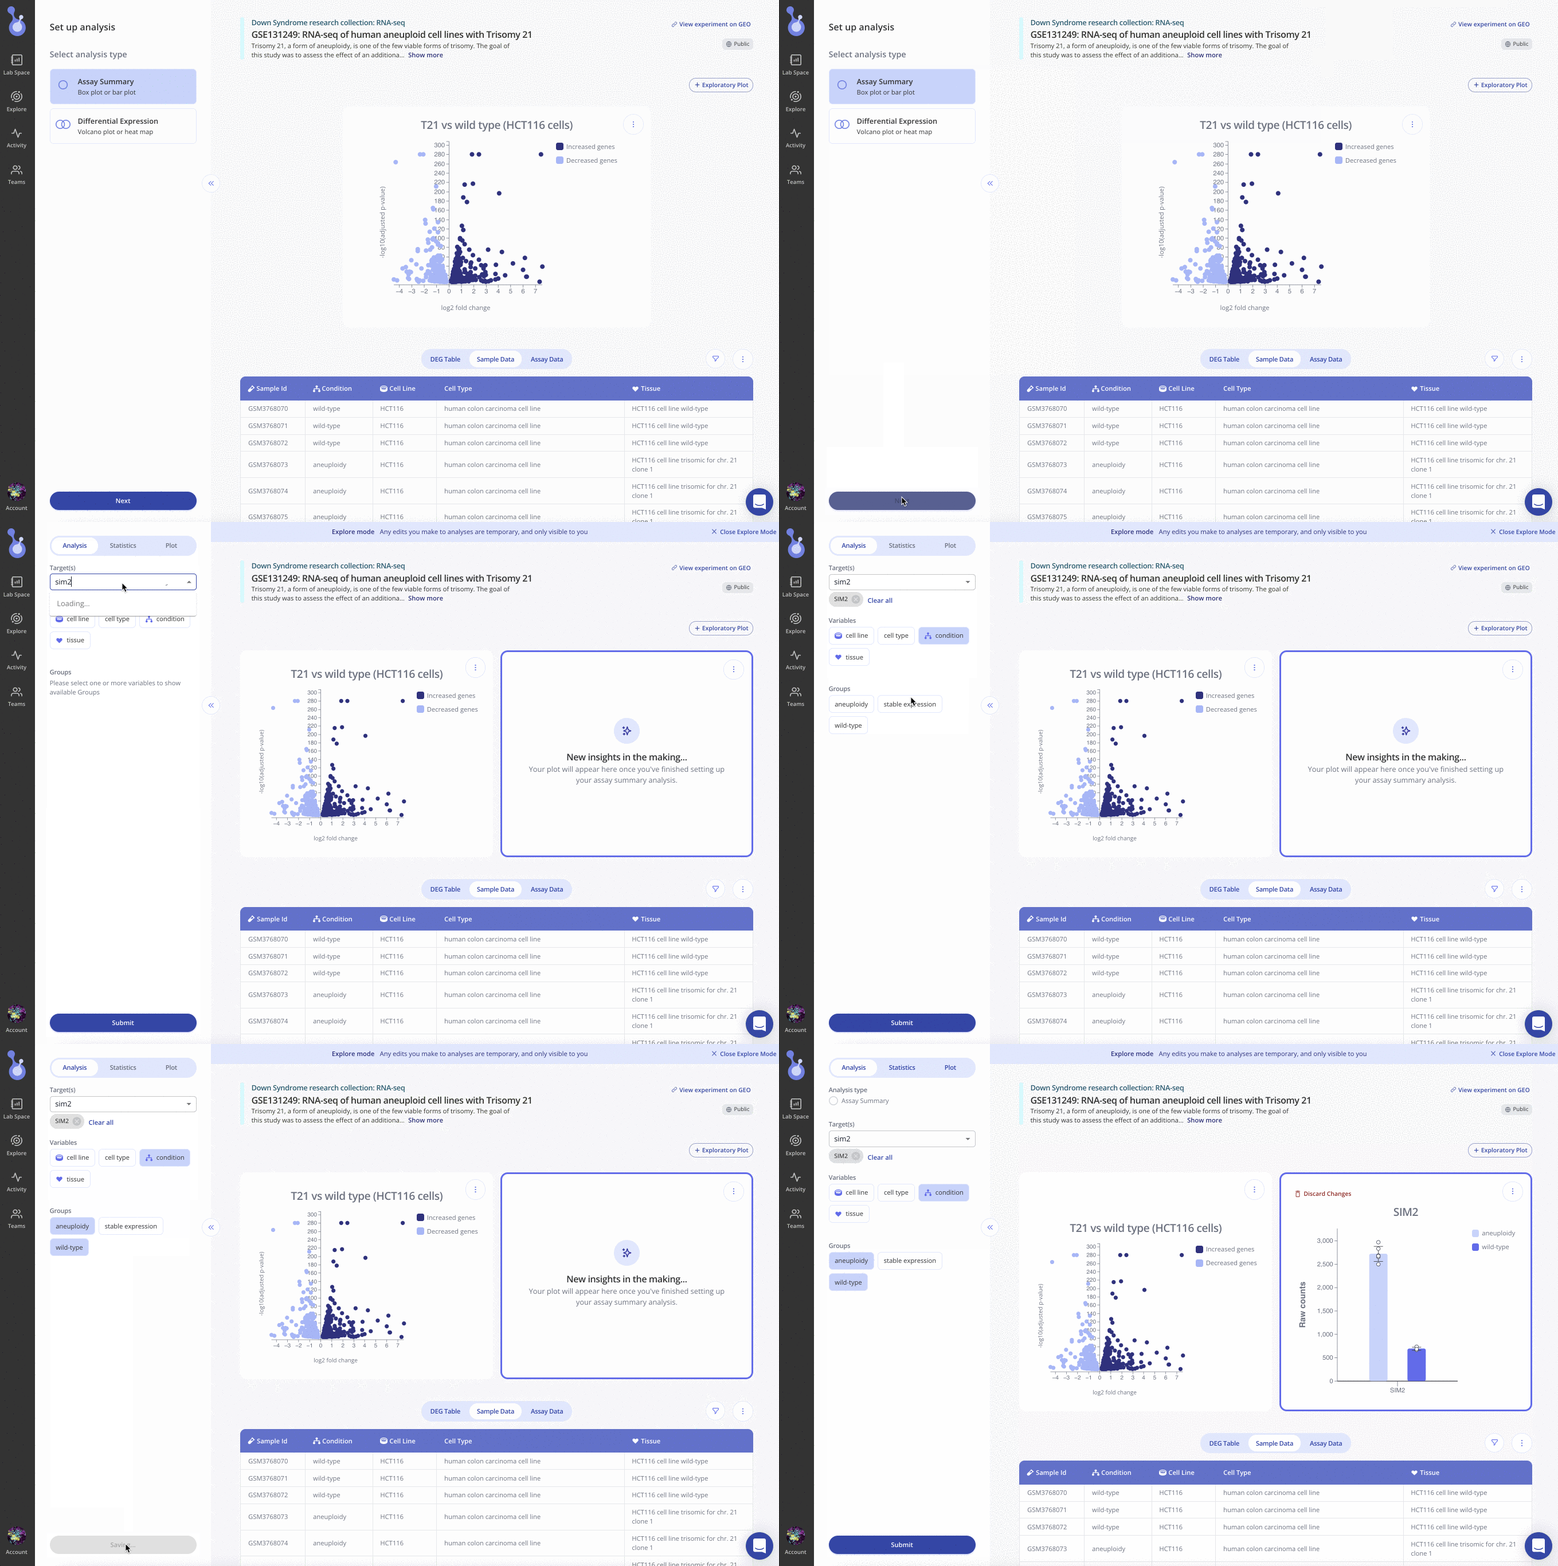
To perform a summary analysis, select "Assay summary" and complete the required fields to produce a summary plot:

Once created, you can customize the plot appearance with the Plot tab, or run statistical tests in the Statistics tab of the left sidebar.
2. Differential expression
Select this option to perform differential expression analysis comparing two groups, which you'll define in the second step. Note: differential expression analysis is only available on RNA-seq experiments. The types of plots you'll be able to create from this analysis include a volcano plot.
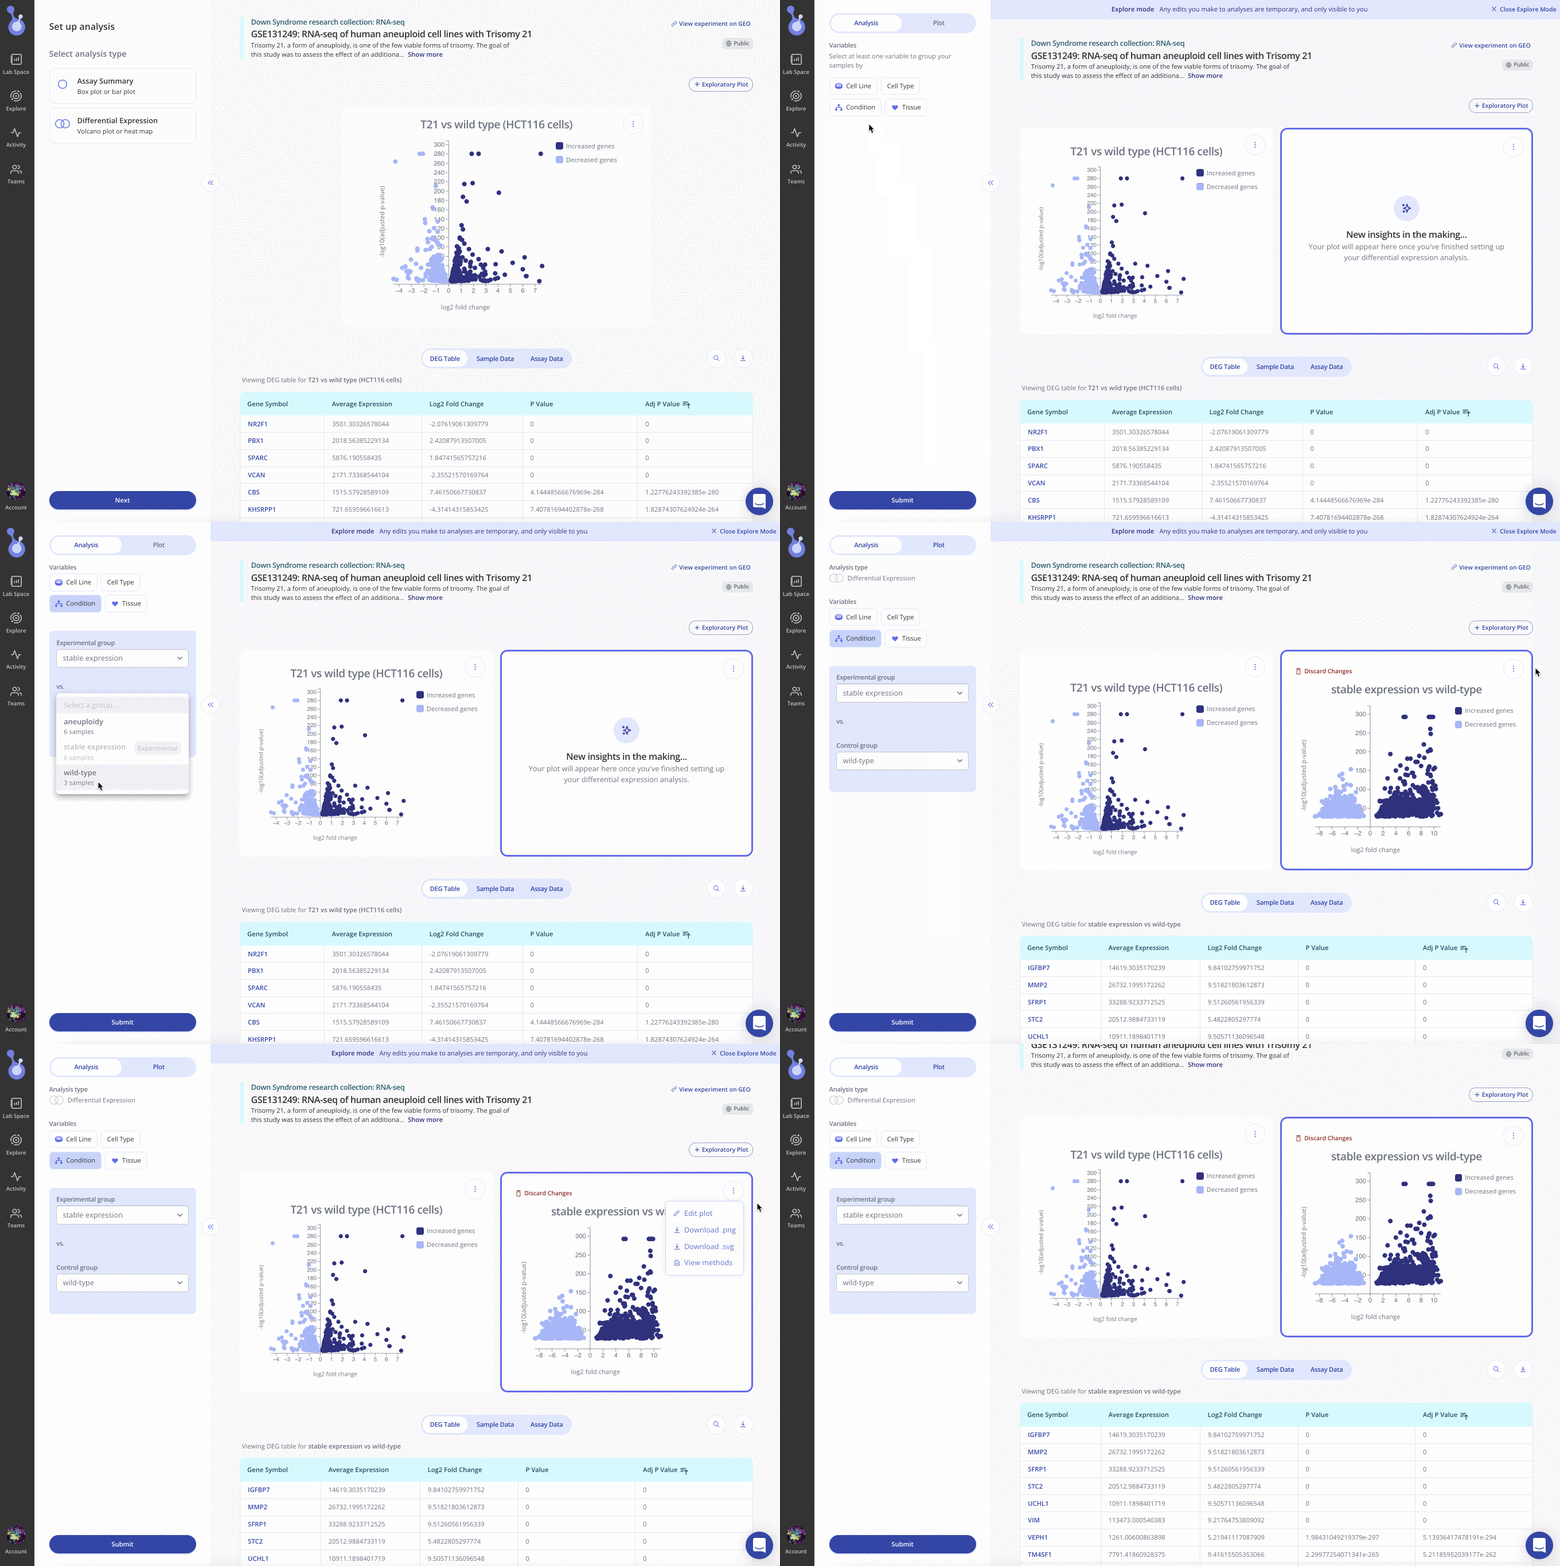
To perform differential expression analysis, select "Differential expression" and select one or more variables to split your samples by, then define your Experimental and Control groups for comparison.

Once created, you can customize the plot appearance with the Plot tab in the left sidebar. You can also download the differentially expressed gene (DEG) table for your comparison using the 3-dot menu on the DEG table.
