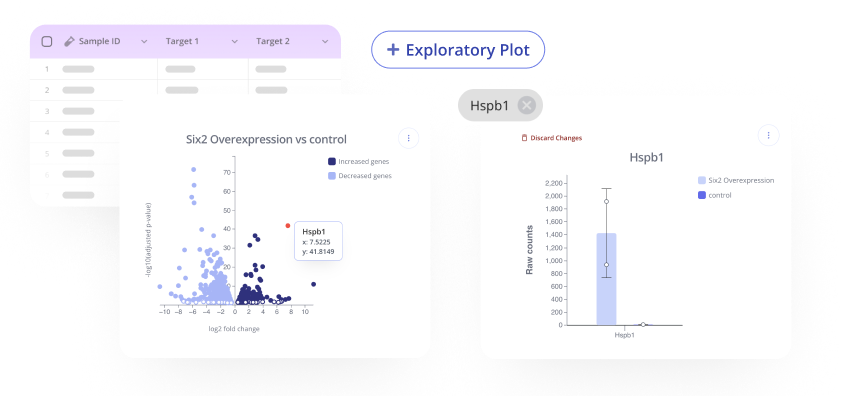
Interactively perform your own analysis and create new plots for any published experiment
Have you ever been viewing some new results and wished that you could interact with the data itself? Or just needed to tweak the colors on a plot but had to wait days for your collaborator to fix it?

Whether you've been granted view access to a private experiment, or you're exploring one of the thousands of published experiments on Pluto, you can use the Exploratory Plot feature to perform your own analysis on the data.
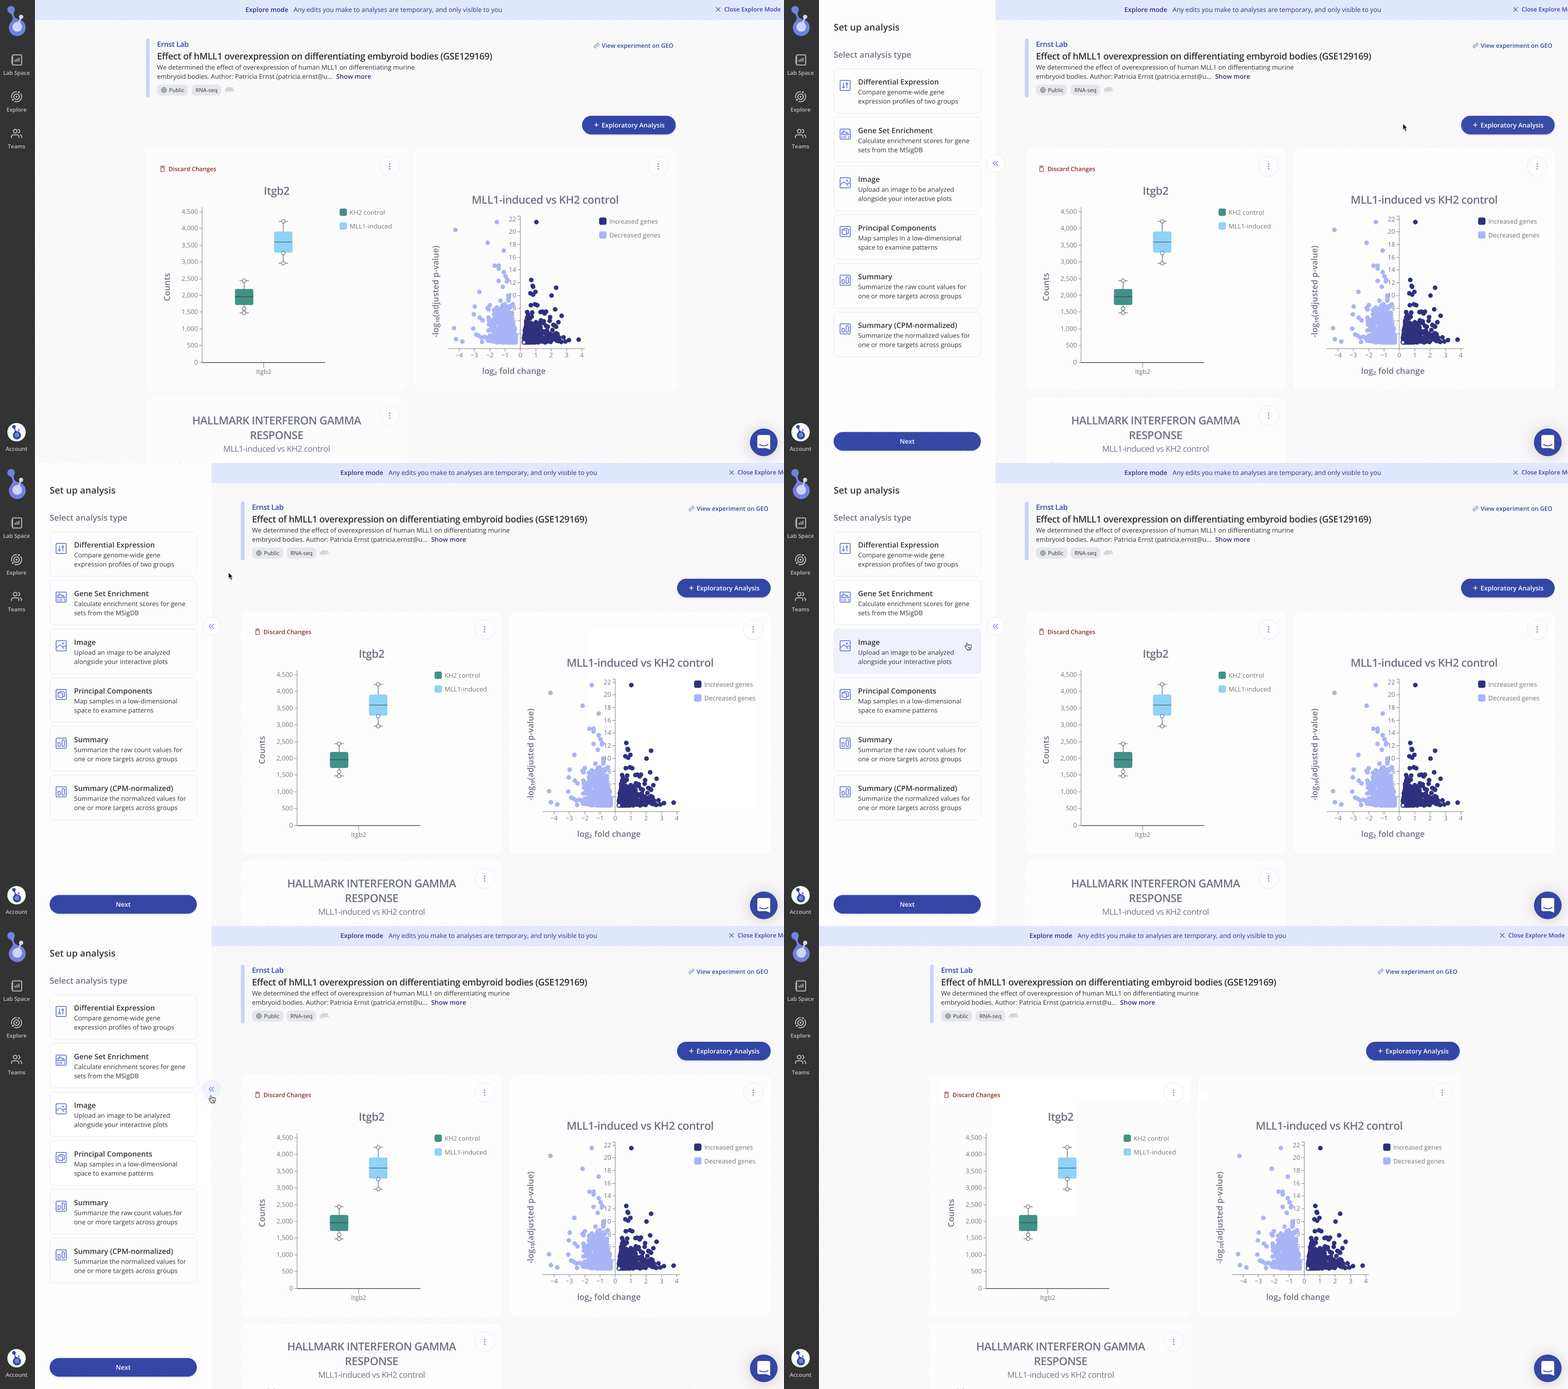
From the experiment page, click on the "+ Exploratory Plot" button in the upper right on the experiment page to create your own exploratory plot.
A sidebar will open up on the left side of the page and you'll be prompted to select an analysis to perform. The types of analyses available will depend on the experiment type.

Analyses in Pluto
Summary analysis
Select this option to summarize the data points generated in the experiment. For sequencing-based experiments like RNA-seq or ChIP-seq, you can also select the Summary (CPM-normalized) analysis type to plot normalized data.
Once created, you can customize the plot appearance with the Plot tab, or run statistical tests in the Statistics tab of the sidebar.
Differential expression analysis
Select this option to perform differential expression analysis comparing two groups of samples, which you'll define in the second step. First, select Differential expression analysis and select one or more variables to split your samples by, then define your Experimental and Control groups for comparison.
Once created, you can customize the plot appearance with the Plot tab in the left sidebar. You can also download the differentially expressed gene (DEG) table for your comparison from the Results tab.
Gene set enrichment analysis
Image analysis
Principal components analysis
