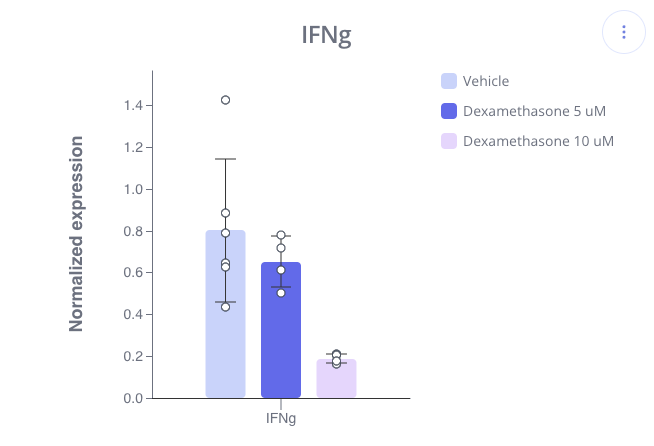
Commonly used tests include the t-test, ANOVA, and Kruskal Wallace
When comparing groups using a barplot or boxplot, it is typical to ask "What is the statistical significance?" Pluto allows you to perform several of the most commonly used statistical tests.
See below for information on when to use each test, and how the statistic is calculated.

Two-sample, unpaired t-test
This is a two-sided test for the null hypothesis that 2 independent samples have identical average (expected) values. This test does not assume that the populations have identical variances. The output of the t-test is a p-value, which quantifies the probability of observing as or more extreme values assuming the null hypothesis, that the samples are drawn from populations with the same population means, is true. Thus, a low p-value (e.g. 0.01) indicates that the measured difference was unlikely to have occurred by chance.
In Pluto, the two-sample, unpaired t-test is calculated using the scipy.stats.ttest_ind function in Python with the following parameters:
One-way ANOVA
The one-way ANOVA tests the null hypothesis that two or more groups have the same population mean. The test is applied to samples from two or more groups, possibly with differing sizes.
The ANOVA test has important assumptions that must be satisfied in order for the associated p-value to be valid.
-
The samples are independent.
-
Each sample is from a normally distributed population.
-
The population standard deviations of the groups are all equal. This property is known as homoscedasticity.
If these assumptions are not true for a given set of data, it may still be possible to use the Kruskal-Wallis H-test (see below).
The length of each group must be at least one, and there must be at least one group with length greater than one. If these conditions are not satisfied,
In Pluto, the one-way ANOVA is calculated using the scipy.stats.f_oneway function in Python.
Kruskal-Wallis H-test
The Kruskal-Wallis H-test tests the null hypothesis that the population median of all of the groups are equal. It is a non-parametric version of ANOVA. The test works on 2 or more independent samples, which may have different sizes. Note that rejecting the null hypothesis does not indicate which of the groups differs. Post hoc comparisons between groups are required to determine which groups are different.
This test assumes that H has a chi square distribution, therefore the number of samples in each group must not be too small. A typical rule is that each sample must have at least 5 measurements, and this requirement is implemented in Pluto.
In Pluto, the Kruskal-Wallis H-test is calculated using the scipy.stats.kruskal function in Python.
