Exploring spatial data in Spatial Studio
Last updated: September 10, 2026
Written by Caitlin Winkler, Ph.D.
Spatial Studio is where you visualize and interrogate your spatial transcriptomics data in Pluto. This guide covers how to read every statistic in the viewer.

Spatial Studio demo: using the lasso feature to perform differential expression analysis on two custom groups
What the viewer tells you about your data
The top bar of Spatial Studio carries a few disclosures, so you never have to guess what happened to your values.
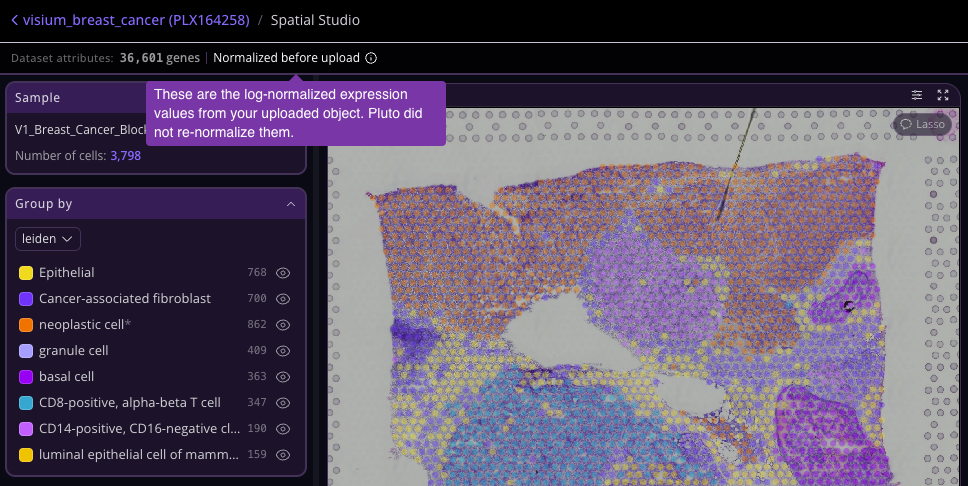
The gene count
The header states how many genes are in your dataset. If Pluto can tell that your object was a subset of a wider panel, it flags that and states the source panel width.
The absence of a flag is not confirmation that your panel is complete.
If you subset your genes without setting adata.raw, Pluto has no way to know, so it says nothing rather than implying otherwise. If your panel size looks wrong to you, trust your own expectation and check your save step.
The normalization label
What you see | What it means |
|---|---|
Normalized before upload | These are your own log-normalized values, passed through untouched. Pluto did not re-normalize them. |
log1p applied by Pluto | Your object was library-size normalized but not log-transformed, so Pluto applied |
CP10K + log1p applied by Pluto | Your object contained raw counts, so Pluto normalized to 10,000 counts per cell and log-transformed. |
Normalization not recorded | This dataset was processed before Pluto tracked this. Re-running the pipeline will record it. |
TIP: Hover over the label for the full explanation. It turns amber only when there is something worth a second look.
When your values came from another matrix
If your uploaded X was scaled, the viewer states which matrix your displayed values came from. Two cases are distinguished:
Recovered from
adata.raworlayers['counts']. You put your data where the AnnData convention says it goes, so Pluto used it. Stated plainly.Recovered from an inferred layer. Neither conventional location existed, so Pluto identified the one layer holding log-normalized values and used it. No convention names that layer, so this is flagged and asks you to confirm it is the matrix you meant to view.
Finding your way around the viewer
What you see when it opens
The first time you open a dataset, Spatial Studio shows a hero panel on the left taking about 60 percent of the width, with your tissue and spots colored by cluster, and a rail on the right holding one smaller UMAP panel. You build out from there.
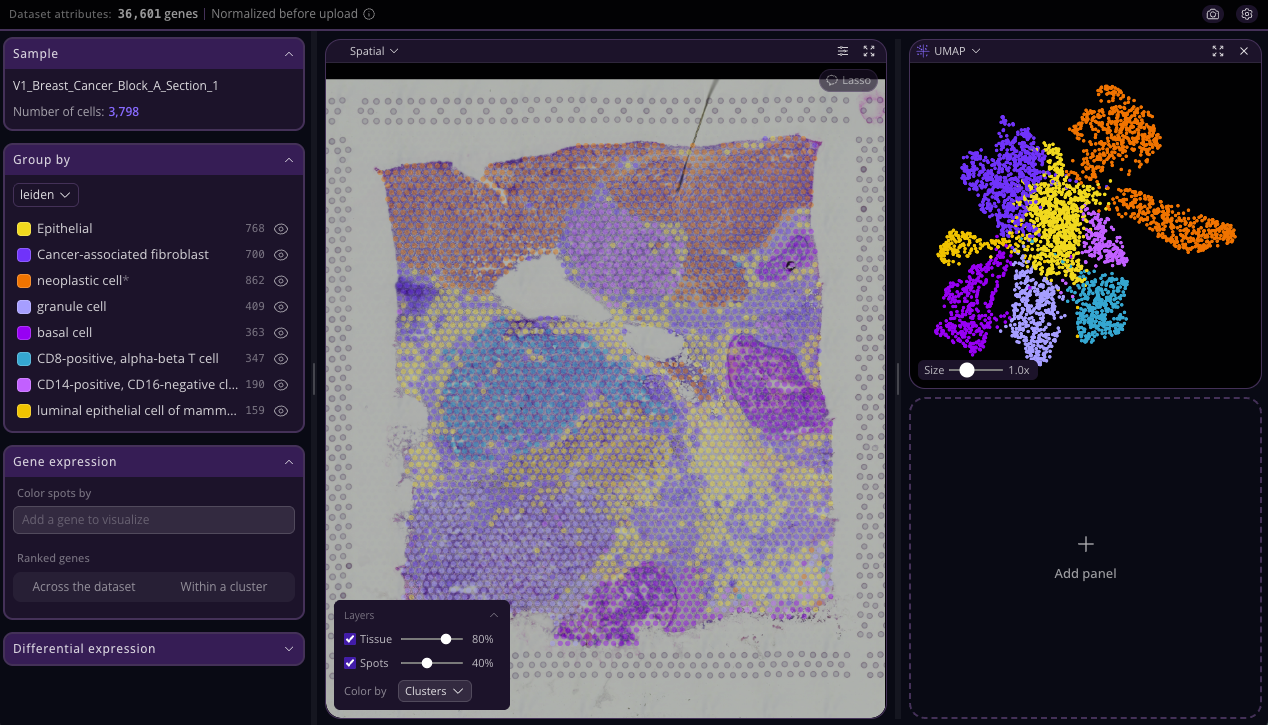
Your layout is then saved in your browser, per dataset, and restored the next time you open that dataset in the same browser. Because it lives in your browser rather than on your account, it does not follow you to another computer or to a teammate's screen, and each dataset remembers its own arrangement independently.
Drag the divider between the hero and the rail to change the split (it stops at roughly a third and four-fifths, so neither side can collapse). Rail rows have their own drag handles for height, and if you add enough panels the rail scrolls.
The sidebar
Section | What it does |
|---|---|
Sample | Switches which sample/section is displayed. Only relevant on multi-sample datasets. |
Group by | Chooses what colors your cells: your clustering, an annotation set, or any categorical column from |
Gene expression | Search a gene to overlay its expression. Search a second to get the two-gene co-expression view. |
Differential expression | Set up and run a DE comparison between two selections or clusters. |

Adding and changing panels
Any panel can become any widget. Each panel has its own picker in its header, including the hero, so you can promote a UMAP or a volcano plot to the big slot when that is what you are working on. Add panel adds another rail panel. Every panel has a maximize control for a full-canvas look, and an "About this widget" note explaining what it shows and how it was computed.
Category | Widgets |
|---|---|
Spatial | Tissue and spots, colored by cluster, a single gene, or two genes for co-expression |
Embeddings | UMAP, PCA |
Plots | Dot Plot, Violin, Heatmap, Expression Box Plot, Sample Composition |
DEG | Volcano, Enrichment Table |
The Spatial widget
The Spatial widget is your tissue-and-spots view, and it is a single widget. Color it by your clusters, by a single gene, or by two genes for a co-expression view, all from controls inside the panel. It replaces what used to be separate Tissue, Clusters, and Gene Expression widgets. Each panel navigates on its own, so panning or zooming one panel does not move the others.
Results panels open themselves
Run a differential expression comparison and a Volcano panel appears in the rail if you do not already have one. If you swap that panel to something else, a later DE run will not reopen it. Enrichment works a little differently: because it is re-runnable, closing its panel and running enrichment again reopens it.
Selecting cells
Use the lasso on a spatial panel to draw a freehand selection, which becomes one side of a DE comparison. You can also compare whole clusters without drawing anything, from the Differential expression section of the sidebar. To find markers of a small population, draw around that population rather than the region containing it. The detection-floor note in the statistics section explains why.
Multi-sample viewing
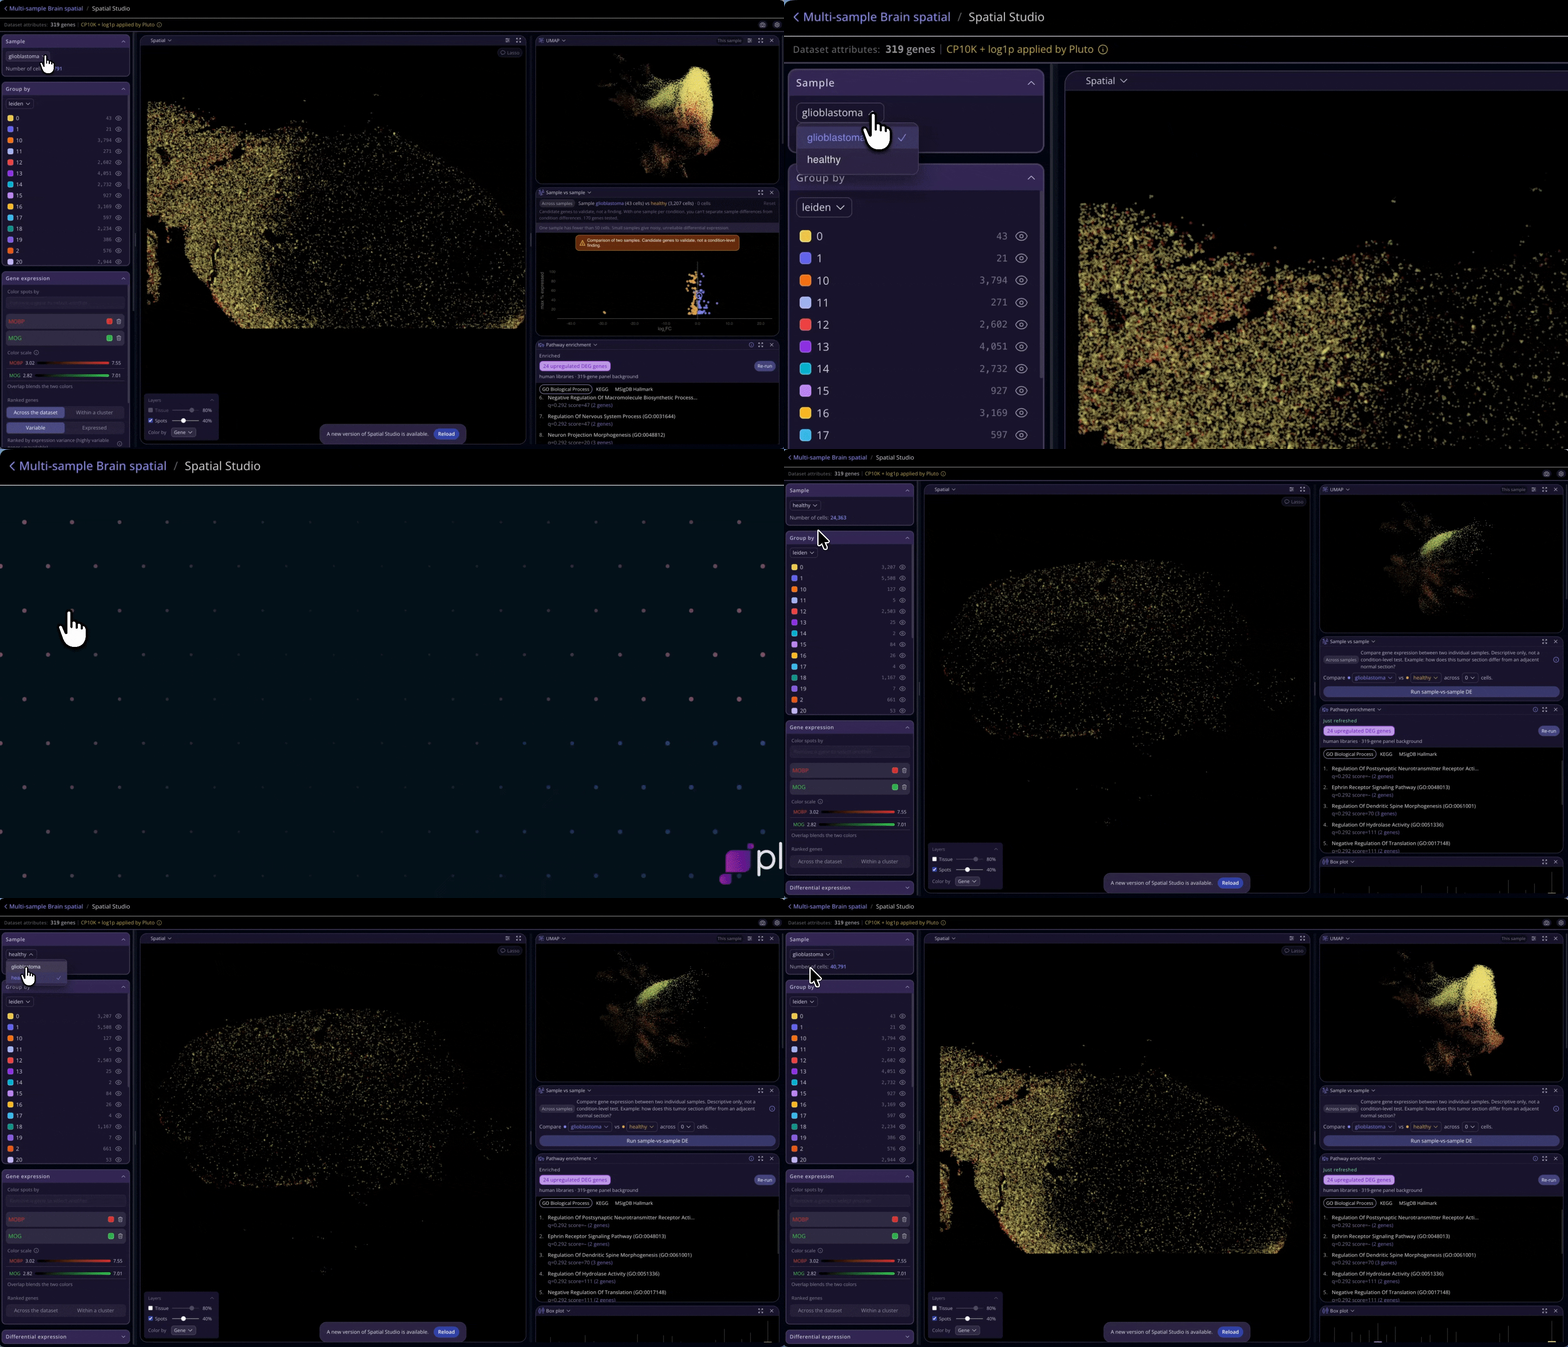
On a multi-sample dataset, the Sample selector switches the active section, and one section renders at a time. The embedding panels additionally offer a This sample / All samples toggle: "This sample" restricts the UMAP or PCA to the active section's cells, while "All samples" shows the full shared embedding. The clustering and the embedding coordinates are the same either way. The toggle changes only which points are drawn, so a cell's position never moves between the two.
The statistics in Spatial Studio
Every statistic uses a standard, published method, computed on your normalized data, with multiple-testing correction wherever p-values are reported.
Feature | Method | Computed by |
|---|---|---|
Marker genes | Wilcoxon rank-sum, one cluster versus the rest (scanpy | Pipeline |
Differential expression | Wilcoxon rank-sum on the normalized layer, BH q-values, volcano plot. Only genes detected in at least 10 percent of cells in one of the two groups are tested, and the panel reports how many were | On demand |
Cross-sample differential expression | Compare two groups of samples you define. With 3+ samples per group, | On demand |
Per-sample composition | How each cluster's share of cells is distributed across your samples, as a per-sample stacked bar | On demand |
Pathway enrichment | Enrichr (GO Biological Process, KEGG, MSigDB Hallmark), using your dataset's own gene panel as the background when it is at least as large as the query list; only KEGG is species-specific (human/mouse), while GO-BP and Hallmark use human-symbol libraries | On demand |
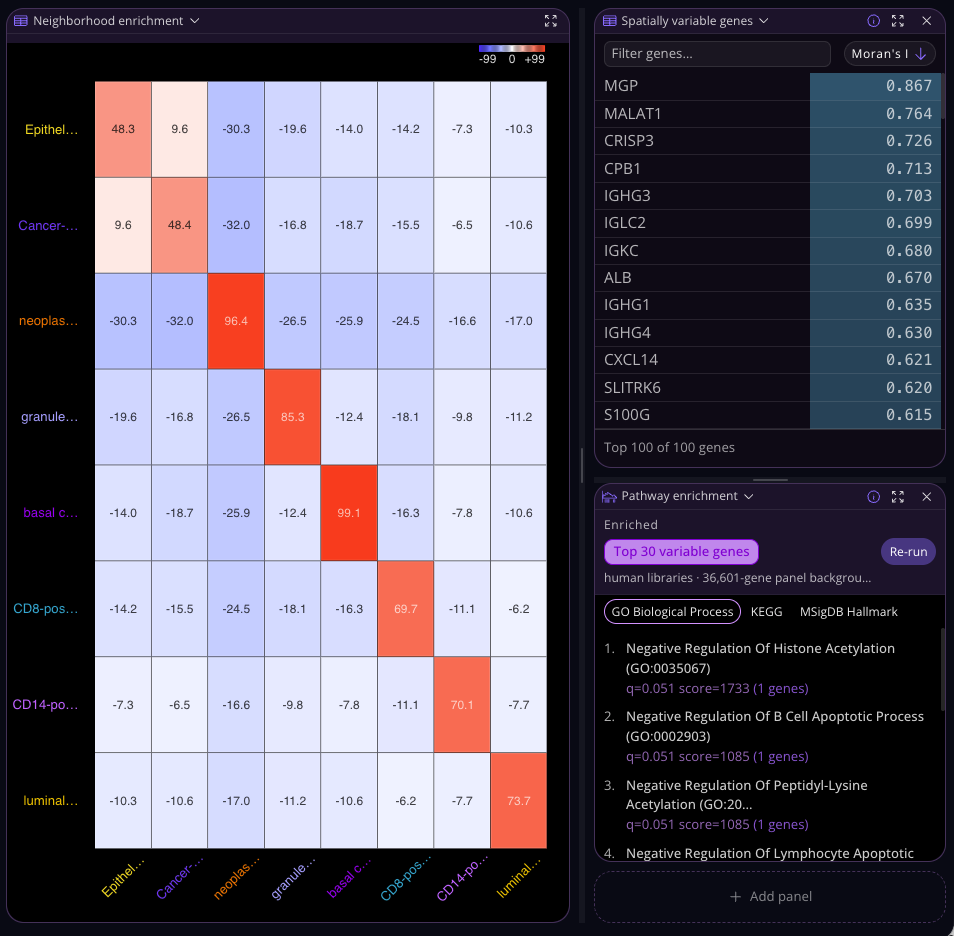
Spatial autocorrelation | Moran’s I on the top 2,000 highly variable genes, using a per-section spatial neighbor graph | Pipeline |
Neighborhood enrichment | Permutation-tested z-scores of cluster-pair spatial adjacency (500 permutations, seeded), on the pipeline’s per-section graph | On demand |
Co-expression | Pearson correlation of two genes, computed across the spots where at least one of the two is detected, with a dual-gene overlay. | On demand |
Reading Moran’s I
Moran’s I measures whether a gene’s expression is spatially structured. The graph is built per tissue section, so cells in two physically separate sections are never treated as neighbors even if their coordinates overlap.
Near +1: expression is spatially clustered, nearby locations are similar.
Near 0: no spatial structure, essentially random.
Negative: a dispersed, checkerboard-like pattern. Rarer.
It is computed on the top 2,000 highly variable genes, not the whole panel. If a gene you expected is absent from the spatially-variable-genes table, that is usually why: it fell outside the top 2,000 by variability. Gene expression overlays and differential expression are unaffected and still cover your full served panel.
Neighborhood enrichment needs the pipeline's graph
Neighborhood enrichment reads the spatial neighbor graph the pipeline built, and Spatial Studio never builds its own substitute. If a dataset was processed before that graph became part of the bundle, the feature reports that it is unavailable rather than approximating the graph in the browser and giving you a number of unknown provenance. Re-running the pipeline adds the graph and the feature becomes available.
This is deliberate: an in-browser approximation would have produced adjacency statistics that looked identical to the real ones but were computed on a different graph.
Differential expression: one behavior to know about
Differential expression tests a gene only if it is detected in at least 10 percent of the cells in one of your two groups. This is the Seurat FindMarkers default, and it keeps the false-discovery correction over genes that were genuinely tested.
A gene expressed strongly in only a small subpopulation inside a larger selection will not appear in your results at all. It is absent, not listed as non-significant. If you lasso a large region containing a rare immune infiltrate, that infiltrate’s markers can be filtered out before testing.
The volcano panel tells you how much of your panel this affected. Its header reads, for example, 1,203 of 5,000 genes tested, so you can see at a glance whether most of your genes were tested or most were filtered. If a selection produces nothing testable at all, the plot says “No genes passed the detection floor” rather than appearing broken. The method tooltip on the same panel states the rule.
If you are looking for markers of a rare population, select that population directly rather than the region containing it. Its markers will then be broadly detected within your selection and will come through.
Very large selections are subsampled
Differential expression caps each group at 20,000 cells. If you select more than that, Spatial Studio takes a random sample of 20,000 (using a fixed seed, so the same selection gives the same result on a re-run) and tests on that. This keeps the test interactive on Xenium-scale datasets, where a selection can run into hundreds of thousands of cells.
When it happens, the panel tells you: you see a note reading something like "Group A subsampled from 340,000 to 20,000 cells." It changes your results very little, because at 20,000 cells per group a Wilcoxon test already has far more power than the effect sizes you are looking for require. It is reported so the number of cells in your selection and the number tested do not appear to disagree.
Two smaller guards on the same panel: a group with fewer than 10 cells cannot be tested at all, and below 50 cells results are flagged as less reliable.
Cross-sample differential expression, and how far to trust it
When you have multiple samples, you can assign them to two named groups and compare the groups rather than individual cells. How much this result can support depends entirely on how many samples are in each group, and the viewer states which case you are in:
3 or more samples per group. A pseudobulk test via
pydeseq2(the DESeq2 method), with each sample as the unit of replication. This is the only configuration that supports a condition-level claim with FDR control.Exactly 2 samples per group. The same test runs, but it is flagged underpowered and the results are preliminary.
1 sample per group. A condition-level claim is not possible, because sample and condition cannot be separated. Spatial Studio offers an exploratory sample-versus-sample comparison instead and labels it descriptively rather than as a condition difference.
Every cross-sample result also carries a dispersion level. Dispersion measures how variable a gene's counts are between your samples, beyond what the count model expects. At medium or high gene-level dispersion, pydeseq2's false-discovery control runs above its nominal rate, so a q-value of 0.05 is doing less work than it appears to, and adding samples does not fix it.
When Spatial Studio detects that, it flags the comparison with a caveat, and those hits should be treated as candidates to validate, not as confirmed condition differences. A low-dispersion comparison is flagged as calibrated. The claim badge is drawn into the plot image itself, so it travels with the figure if you export or screenshot it.
Differential expression and enrichment are exploratory
Both are built for fast hypothesis generation while you explore. The methods are standard and the results are sound for interrogating your data. For a publication or a regulatory filing, confirm key findings in a dedicated, fully specified analysis, as you would with any exploratory tool.
Where your data goes
Your expression data and samples stay in Pluto. The one exception is pathway enrichment, which sends the gene symbol list from a differential expression result to Enrichr, an external web service. It sends at most 200 gene symbols, plus your dataset's gene-symbol panel when it is used as the statistical background. Nothing else leaves Pluto: no expression values, no cell or spot counts, no coordinates, and no sample identifiers. If your organization has strict data-handling requirements, this is the one feature to review.
Naming and coloring your clusters
Whatever clustering you upload becomes an annotation set in Pluto: either numbered clusters or your existing annotations, depending on what was in your object and what you selected during mapping.
On the Annotations page you can:
Label or relabel every cluster and set its color.
Use the CellKB integration to suggest cell-type labels from each cluster’s top marker genes.
Any change you make on the Annotations page flows into Spatial Studio automatically, so the viewer always reflects your current curation. Spatial Studio displays your labels and never runs its own annotation.
Merging Clusters
If you give two or more clusters the same label, Spatial Studio treats them as one group everywhere: one legend entry, one color, and one set of counts, rather than duplicate rows sharing a name. This is how you consolidate an over-clustered result without re-clustering upstream. Relabel "cluster 3" and "cluster 7" both as "T cells" and they behave as a single group in the legend, in spot coloring, in plots, in composition, and in neighborhood enrichment.
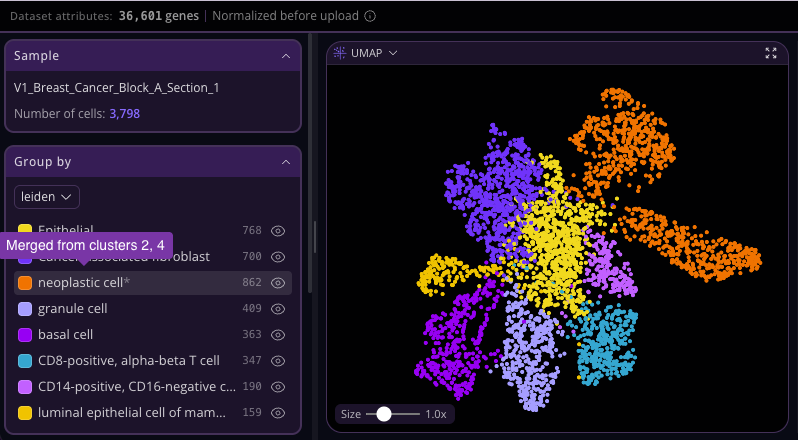
Merging is the one case where Spatial Studio computes something your pipeline run could not have. A merged group did not exist when markers were computed, so its marker list starts as the combination of its members' existing markers, and you can ask Spatial Studio to run a fresh one-versus-rest test across the merged group's cells on demand. Give the clusters different labels again to split them back apart.
FAQs
What does the normalization label mean?
It reports what the pipeline did to your values. See the table above. “Normalization not recorded” means the dataset predates Pluto tracking this, and re-running the pipeline will fill it in.
Why does a gene from my rare cell population not appear in my DE results?
Differential expression only tests genes detected in at least 10 percent of the cells in one of the two groups. A marker of a small population inside a large selection can fall below that and be filtered out before testing, so it is absent rather than non-significant. Check the tested-gene count in the volcano header to see how much of your panel was filtered, then select the rare population directly and its markers will come through.
Why does it say my object is a gene subset?
Because adata.raw in your object is wider than the gene list Pluto served, which is the signature of a highly variable gene subset saved after adata.raw = adata. A gene you cannot find may have been dropped at save time rather than undetected. Re-save without the subset to make your full panel searchable.
Why do my Xenium or MERFISH markers show very small p-values and large fold-changes?
Two things combine on imaging platforms: a small targeted gene panel and a very large number of cells. With that many cells, standard tests return extremely small p-values, and fold-changes on a targeted panel can look large. This is expected. Rank by effect size and biological plausibility, and treat the exact p-value as a ranking signal rather than a literal probability.
I uploaded scaled data. What happened?
Scaled expression contains negative values and cannot be log-normalized, so Pluto looked for your pre-scaling values in adata.raw, then layers['counts'], then a single log-normalized layer, and used the first it found. The viewer states which. To avoid the ambiguity, save with un-scaled log-normalized values in X.
Why is neighborhood enrichment computed per section?
Coordinates are normalized within each tissue region, so two separate sections can overlap in coordinate space. Building the graph per section prevents cells in different physical sections from being treated as neighbors. The graph is built once by the pipeline and read by the viewer, so the numbers cannot drift between the two.
Why is neighborhood enrichment unavailable for my dataset?
Because the dataset was processed before the spatial neighbor graph became part of the bundle. Spatial Studio reads that graph and will not build a substitute in the browser, since an approximation would look like the real thing while being computed on a different graph. Re-run the pipeline and the feature becomes available.
Why does my panel say my selection was subsampled?
Differential expression caps each group at 20,000 cells for interactivity. Larger selections are randomly sampled down to that, with a fixed seed so the result is reproducible. At that many cells the test still has far more power than you need, so this rarely changes conclusions. It is reported so the cell count in your selection and the count tested do not look inconsistent.
How do I combine two clusters into one?
Give them the same label on the Annotations page. Spatial Studio treats clusters sharing a label as a single group everywhere: legend, coloring, plots, composition, and neighborhood enrichment. Give them different labels again to split them apart.
Can I trust a cross-sample comparison with only two samples per group?
Treat it as preliminary; the viewer flags it as underpowered. Three or more samples per group is what supports a condition-level, FDR-controlled claim. Also check the dispersion badge on the result: at medium or high dispersion, the false-discovery control runs above its nominal rate, and those hits are candidates to validate rather than confirmed findings.
Does my layout carry over between sessions?
Yes, within the same browser. Your panel arrangement, sizes, and view settings save locally per dataset and come back the next time you open that dataset. They do not sync to another computer or to a teammate, so a colleague opening the same dataset starts from the default layout.
🚀 Ready to explore your spatial data?
We hope that the guide above helps you feel confident in exploring your spatial data using our Spatial Studio. Hope you enjoy generating new hypotheses! For more resources, we encourage you to take a look at our Blog and Knowledge Base.
Please reach out to support@pluto.bio if you have additional questions.
As always, our scientific support team is here to help! 🧬